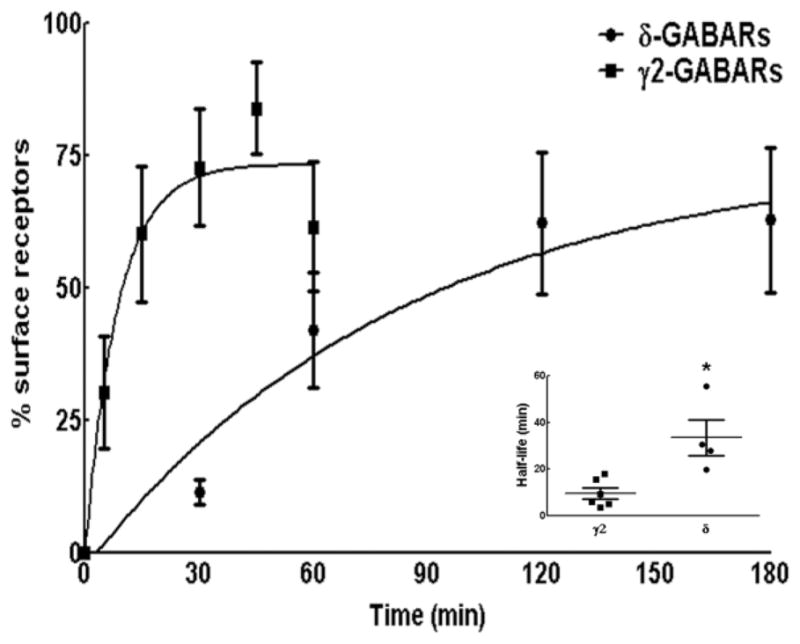
Figure 7.

Comparison of the time course of γ2-GABAR and δ-GABAR insertion over the surface membrane. Newly inserted γ2-GABARs and δ-GABARs over time were plotted as a percentage of surface expressed receptors. n=25–30 neurons from 4–5 replicates per time point. Inset shows half-life of insertion in individual experiments with mean and SEM. N=4–6. * p<0.05.
