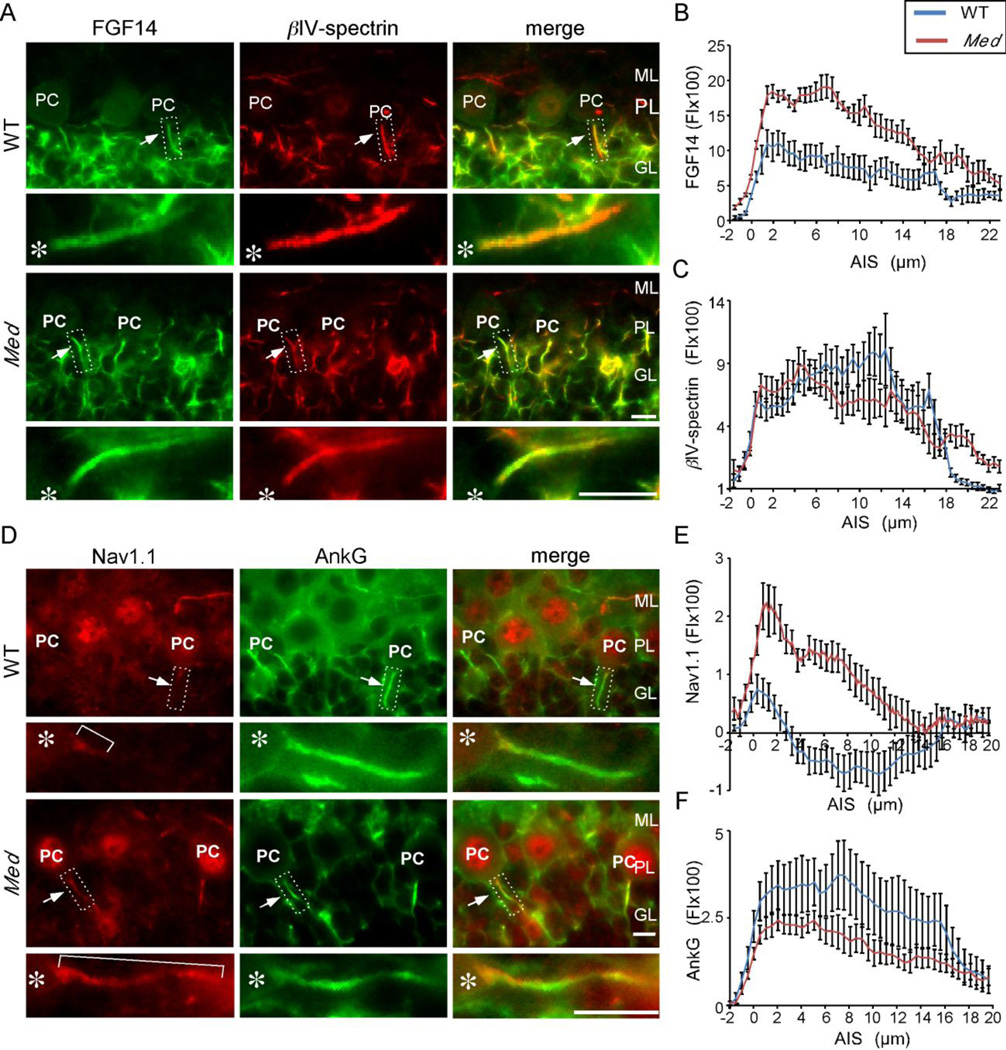
Figure 3. Changes in the AIS inScn8amed Purkinje neurons.
A. Immunostaining showing FGF14 (green) and βIV-spectrin (red) localization in WT and Scn8amed (Med) Purkinje neuron AIS. B, C. Line scan analysis showing increased FGF14 immunostaining (B) and similar βIV-spectrin immunostaining (C) in Scn8amed, compared to WT, Purkinje neuron AIS. Note that the length of the AIS, as demarcated by βIV-spectrin immunostaining, is increased in Scn8amed Purkinje neurons. D. Immunostaining showing Nav1.1 (red) and ankyrin G (green) localization in WT and Scn8amed (Med) Purkinje neuron AIS. E, F. Linescan analysis showing increased Nav1.1 immunostaining (E) and similar ankyrin G immunostaining (F) in Scn8amed, compared to WT, Purkinje neuron AIS. Asterisks mark the locations of the Purkinje neuron soma. FI, Fluorescence intensity; ML, molecular layer, PC, Purkinje neuron soma; PL, Purkinje neuron layer; GL, granule neuron layer. Scale bars are 10 µm. For linescan analyses, n=7–11 values presented are means ± SEM.

