
Figure 1. The stability of k-MT attachments in prometaphase and metaphase.
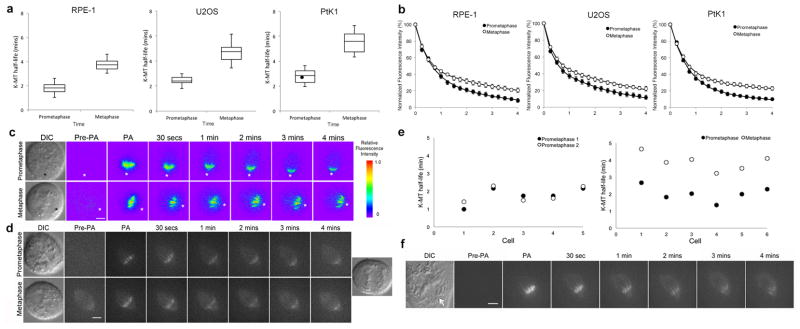
a, Box and whisker plot of k-MT half-lives of RPE-1, U2OS, and PtK1 cells in prometaphase and metaphase calculated from the fluorescence intensity decay curves (r2 > 0.99); n = 40 cells for RPE-1 and U2OS, and 20 cells for PTK1 per condition. Black circle represents the cell from panel f. b, Normalized fluorescence intensity of prometaphase (filled circles) and metaphase (white circles) spindles. c, DIC and background subtracted fluorescence images (pseudo-colored heatmaps) of U2OS cells in prometaphase and metaphase. Asterisks mark spindle poles. Scale bar, 5 μm. d, DIC and fluorescence images of an RPE-1 cell in prometaphase and metaphase. Scale bar, 5 μm. e, k-MT half-life of individual RPE-1 cells photoactivated serially in prometaphase (left) or in prometaphase and then in metaphase (right). f, DIC and fluorescence images of a PtK1 in prometaphase. Arrow indicates unaligned chromosome. Scale bar, 5 μm.