
Figure 3. Cyclin A deficiency increases chromosome mis-segregation.
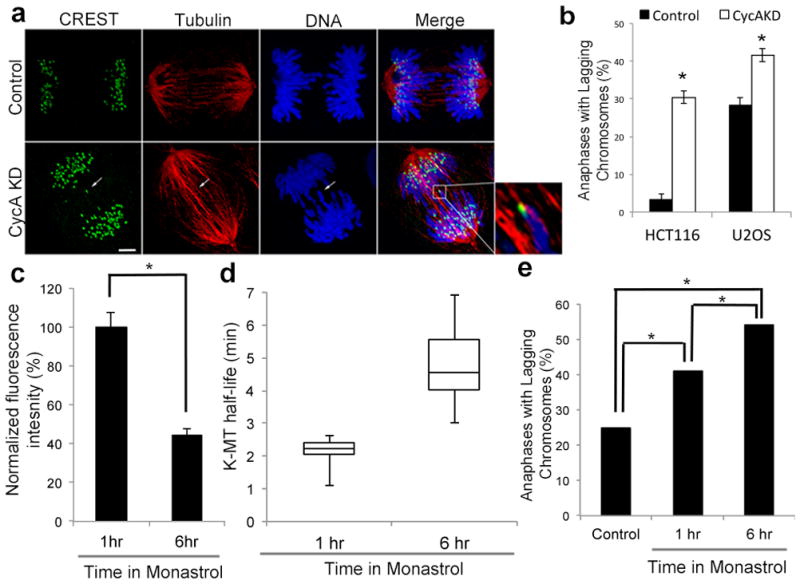
a, anaphase spindles of untreated (control) or cyclin A depleted (CycA KD) U2OS cells. White arrow highlights merotelic kinetochore. Scale bar, 5 μm. b, percent of anaphase cells with lagging chromosomes; n = 300 cells per condition from three independent experiments. c, fluorescence intensities of U2OS cells stained for cyclin A; n = 100 cells per condition from three independent experiments. d, Box and whisker plot of k-MT half-lives of U2OS cells incubated in monastrol for 1 hour (1hr) and 6 hours (6hr); n = 10 cells per condition. e, percent of anaphase cells with lagging chromosomes that were untreated (control), or after recovery from monastrol incubation for 1 hour (1hr) or 6 hours (6hr); n = 100 cells for 1hr and 123 cells for 6 hr. Graphs show mean ± s.e.m. *P ≤ 0.01, two-tailed t-test.