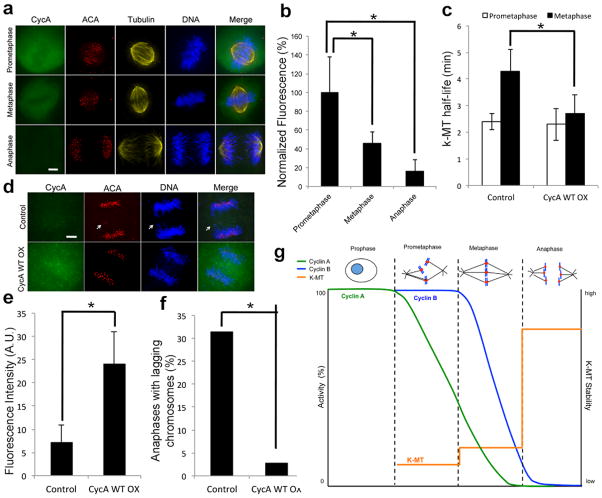
Figure 4. Cyclin A promotes faithful chromosome segregation.
a, Immunofluorescence of endogenous cyclin A, tubulin, centromeres (ACA) and DNA of U2OS cells in prometaphase, metaphase, and anaphase. Scale bar, 5 μm. b, fluorescence intensities of U2OS cells stained for cyclin A; n = 150 cells per condition from three independent experiments. c, k-MT half-life of untreated (control) and cyclin A WT overexpressing (CycA WT OX) U2OS cells; n = 10 cells per condition. d, immunofluorescence of endogenous cyclin A, tubulin, centromeres (ACA) and DNA of control or Cyclin A WT overexpressing (CycA WT OX) U2OS cells. Scale bar, 5 μm. e, fluorescence intensities of cyclin A of control U2OS cells or cells expressing cyclin A WT. f, number of anaphases in U2OS cells with lagging chromosomes; n=150 for control cells and 37 for cyclin A WT cells. g, Cells enter prometaphase with high cyclin A and cyclin B. The proteosome-dependent reduction of cyclin A levels below a critical threshold induces a coordinated increase in k-MT attachment stability at the prometaphase to metaphase transition. Graphs show mean ± s.e.m. *P ≤ 0.01, two-tailed t-test.

