
Figure 3. Results of Experiment 1.
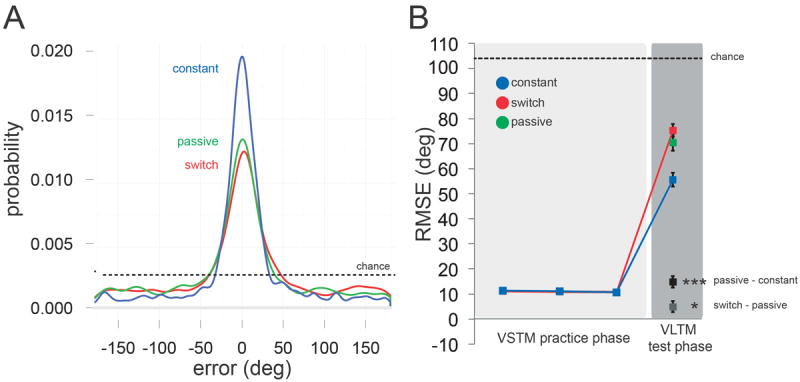
(A) Empirical distributions depicting the probability of observing an error of a given magnitude in the VLTM test for each condition. These distributions were constructed for visualization purposes only, by pooling data across all observers. (B) Task performance across VSTM practice and VLTM test phases as measured by RMSE for objects successfully reported during practice phase. In the test phase, practiced features (Constant) were reported most accurately, while unpracticed features of practiced objects (Switch) were impaired relative to unpracticed features of unpracticed objects (Passive). The height of the dotted line represents expected performance under random guessing. Error bars reflect ±1 SEM. *p<0.05, ***p<0.001.