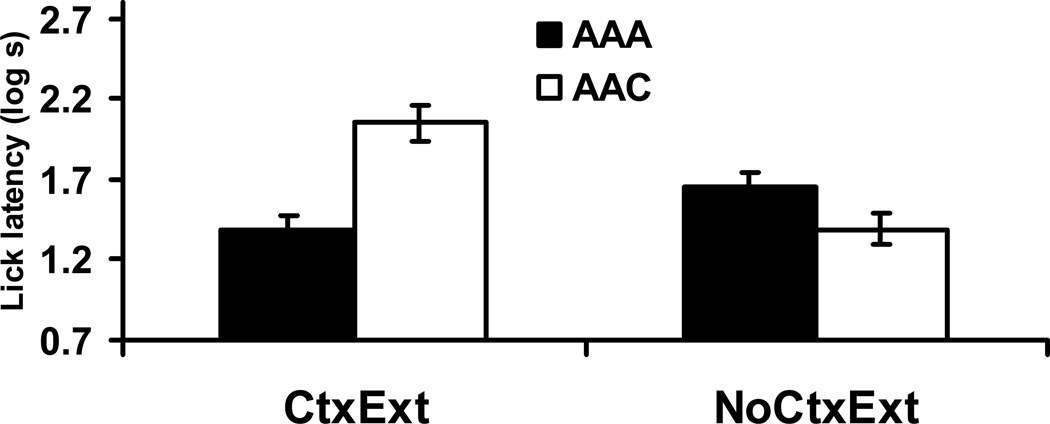
Figure 2. Renewal Test (Experiment 1).
Bars indicate mean log time to complete five cumulative seconds of licking upon being placed in the test context with the CS immediately present in Experiment 1. Higher lick latency scores reflect more fear to the stimulus and context compound. Brackets reflect standard error of the mean (SEM). 0.7 log s corresponds to completion of five cumulative seconds of licking in 5 s, the lowest score possible.

