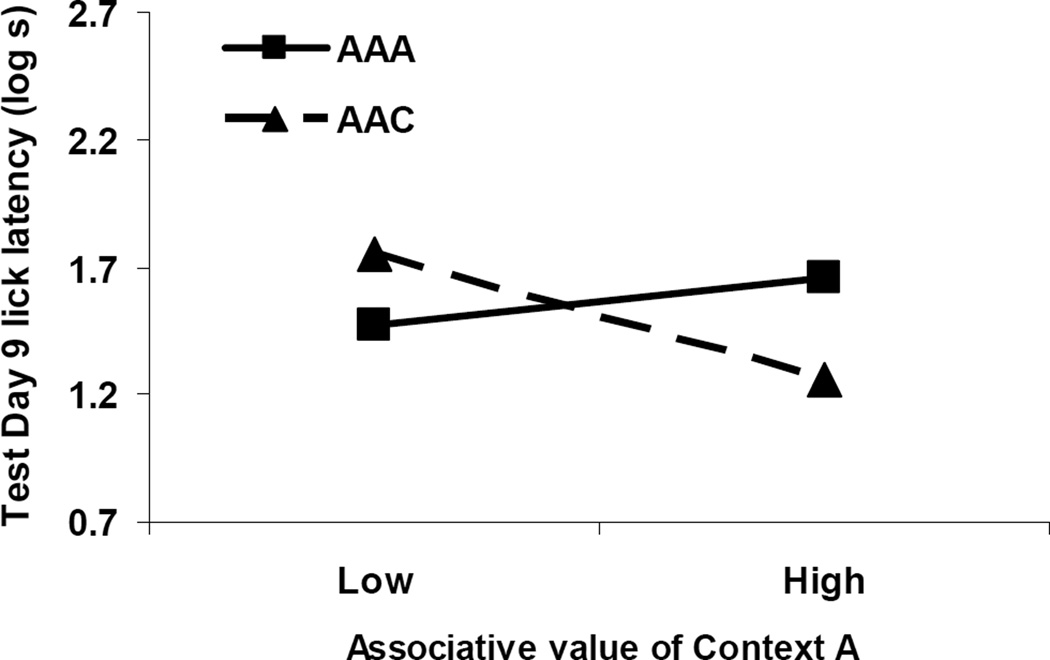
Figure 3. Covariate Analysis (Experiment 1).
The present graph depicts the relationship between responding to Context A alone and responding to CS X in Experiment 1. Subjects were categorized as Low if they were in the bottom 25% of responders from the test of Context A alone, whereas animals were categorized as having High associative value of Context A if they were in the top 25% of responders during the test of Context A alone. 0.7 log s corresponds to completion of five cumulative seconds of licking in 5 s, the lowest score possible.

