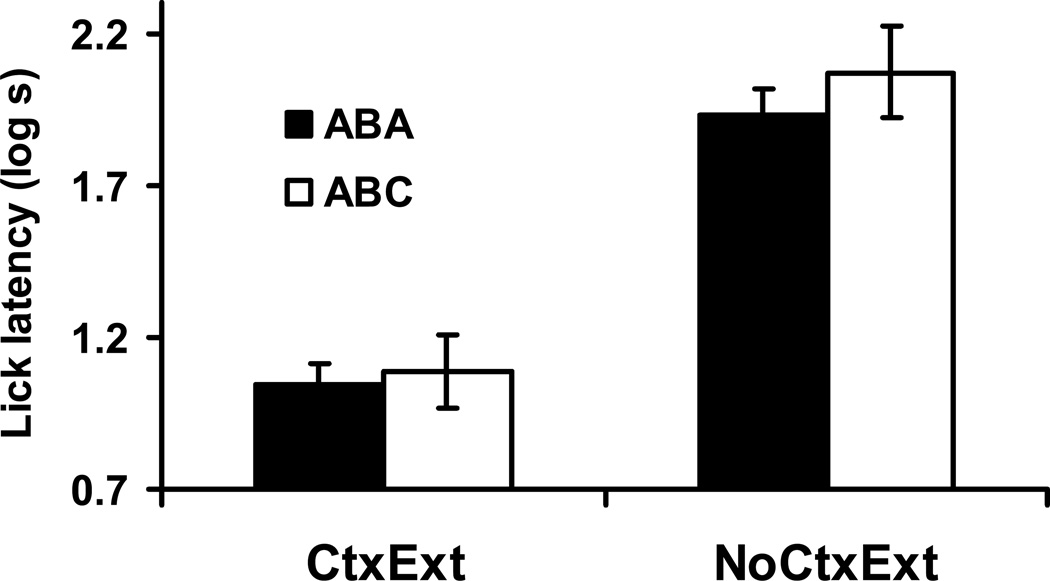
Figure 4. Context Test (Experiment 2).
Bars indicate mean log time to complete five cumulative seconds of licking upon being placed in Context A in Experiment 2. Higher lick latency scores reflect more fear to the Context. Brackets reflect SEM. 0.7 log s corresponds to completion of five cumulative seconds of licking in 5 s, the lowest score possible.

