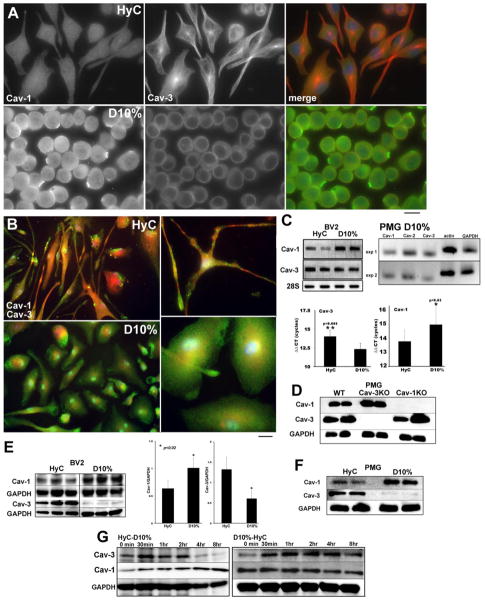
Figure 2. Caveolin isoform expression is cell state specific in both BV2 microglia and neonatal mouse primary microglia cultures (PMG).
A. IF analysis of BV2 cells expression of Cav-1 (left panels) and Cav-3 (middle panels). Cav-1 is minimally expressed as small fine cytoplasmic and PM vesicles in HyC cells and in dense PM patches in D10%. Cav-3 is associated with long processes seen in HyC (top) and also localized in a dense perinuclear region. Lesser cytoplasmic expression and less frequent perinuclear localization are seen in D10% cells (bottom). B. IF analysis of PMG showing highly processed, elongated cells in HyC with increased expression of Cav-3 (red – top panels). D10% cells are rounded with significant Cav-1 label (green) at the PM and in the cytosol. Higher magnification more clearly demonstrates intracellular localization of Cav-3 compared to Cav-1. Magnification = 10μm. C. qPCR analysis of HyC or D10% BV2 cells shows the same pattern for RNA transcripts as protein expression between conditions. Cav-1 mRNA is increased in D10% cells and Cav-3 mRNA is increased in HyC. PCR was normalized with 28S ribosomal RNA and statistically significant ΔΔCT are graphed below (n=3 separate experiments). qPCR (right) products (n=2 experiments) from D10% grown PMG show distinct bands for Cav-1 and Cav-3 with normalizing actin and GAPDH. D. WB analysis of WT, Cav-1 and Cav-3 KO PMG demonstrate specificity of antibodies used and expression of Cav-1 and Cav-3 protein. E. WB analysis, of caveolin isoforms in model conditions, in BV2 cells (left) and PMG (F) demonstrate Cav-1 increases with D10% culture conditions. Cav-3 expression is highest in quiescent HyC cells. Lanes represent cells grown and analyzed separately and blots were normalized with GAPDH (n=3). Statistically significant differences are graphed (right). WT PMG grown in HyC or D10% show similar expression of caveolin as BV2 cells. G. Cav-3 and Cav-1 expression is modulated by phenotype state and can be switched when the conditions change. Cav-3 expression decreases within 4 hours of FBS treatment in HyC cells. Cav-1 expression decreases more slowly when FBS is removed and cells revert to a more resting phenotype (D10% to HyC switch).

