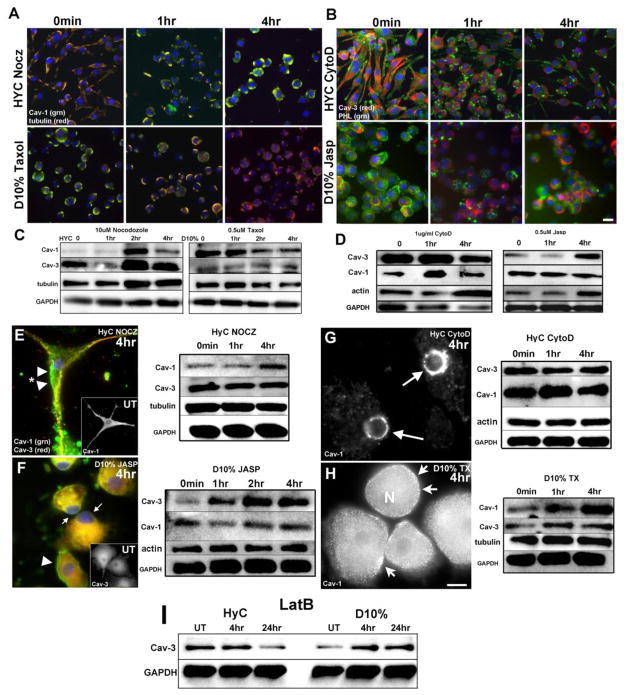
Figure 4. Depolymerizing or stabilizing cytoskeletal proteins alter expression and localization of Cav-1 and Cav-3 in BV2 cells and PMG.
A. Microtubules were either depolymerized with 10μM nocodazole (Nocz) to disrupt processes in HyC cells or stabilized with 0.5μM pacliltaxel (Taxol) in D10% cells. Tubulin (red) appears mainly associated with PM domains, with limited staining seen through the processes, consistent with the compartmentation experiments of Fig. 4A. Cav-1 (green) expression shows a reduction over time at 4 hours in D10% cells while HyC cells increase the expression of Cav-1 and at 4 hours resemble the initial time 0 of D10% cells. B. Actin was either depolymerized with 1μg/ml cytochalasin D (CytoD) to disrupt processes in HyC cells or stabilized with 0.5mM jasplakinoide (Jasp) in D10% cells. Actin, stained with PHL (green), localizes to processes and in globular bundles in HyC cells and mainly as cortical or perinuclear actin in D10% cells. Cav-3 (red) does not colocalize with actin in either condition, indicating discrete domain separation. HyC cells show a loss of Cav-3 as actin becomes increasingly concentrated to shrinking processes. In D10% cells, expression of Cav-3 increases as actin becomes more concentrated intracellularly. C–D. WB analysis of all treatments confirms the expression patterns seen by IF. Cav-1 expression increases within 2 hours in the HyC cells treated with Nocz and decreases by 2 hours in D10% cells treated with Taxol (C). Minimal changes were seen for Cav-3 following microtubule toxin treatment. Cav-3 expression decreases in HyC treated with CytoD within 4 hours and increases in D10% treated with Jasp at 4 hours (D), with minimal changes in Cav-1 seen following CytoD treatment. Magnification bar = 10μm. E–H. Results of IF and WB analysis, of PMG cells, treated with cytoskeletal toxins. E. HyC grown cells treated with 10μM Nocz do not lose their processes but show an increase in Cav-1 expression both at the PM (arrowheads) and in intracellular domains. Cav-3 (red) remains in processes. WB analysis mirrors the IF with Cav-1 (top) increasing by 4 hours and Cav-3 unchanged. F. D10% cells treated with 0.5μM Jasp result in the greatest morphological changes. Nuclei become eccentric (arrows), Cav-3 expression increases and condenses in intracellular domains. Cav-1 remains at the PM (arrowhead) and expression is largely unchanged. WB analysis shows a similar expression pattern as the IF, with Cav-3 (top) increasing by 2 hours. Insets are untreated (UT) 0 minute cells showing typical Cav-1 distribution in HyC cells and typical Cav-3 distribution in D10% cells. G. When HyC cells are treated with CytoD, unlike BV2 cells, neither isoform expression is altered, but localization of Cav-1 shifts from PM and intracellular domains to a perinuclear ring (arrows). H. Stabilizing microtubules in D10% cells increases Cav-1 expression and increases PM localized Cav-1 positive vesicles (arrows) in denser patched areas. Nuclei remain centric (N) and Cav-3 expression is unchanged. Magnification bar = 10μm. I. When G-monomers are sequestered with 0.5μM LatB, in PMG, Cav-3 decreases by 24 hours in HyC cells and increases within 4 hours in D10% cells.

