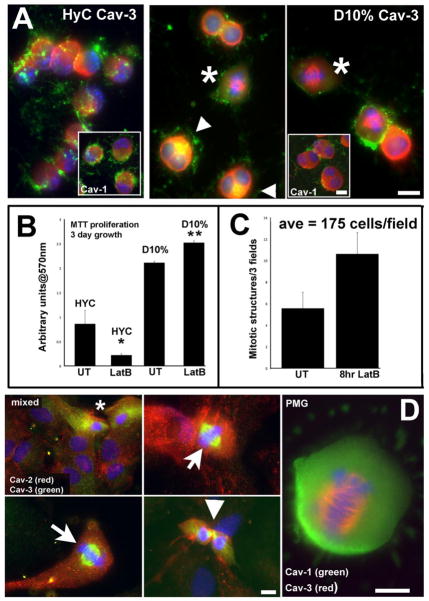
Figure 5. Cav-3 localizes to mitotic structures in cells, either induced to proliferate with LatB or in proliferative cultures.
A. Following 8 hours of 0.5μM LatB treatment, HyC cells round, lose filamentous actin structure, and both caveolin isoforms concentrate in opposite polar ends to shrinking nuclei. Cav-3 concentrates in intracellular regions. D10% cells show cellular enlargement and increased numbers of mitotic cells. The mitotic figures seen in D10% cell have specific Cav-3 labeling on the mitotic spindle (*) and perinuclear areas (arrows) colocalize with actin. Insets are the corresponding Cav-1 labeled cells with a different distribution from Cav-3. B. Sequestering G-actin with 0.5μM LatB in either condition effects the survival or proliferation of the cells. An MTT assay quantified the increase in proliferation of LatB treated D10% cells and the probable cell death or retarded growth seen in HyC cells after 3 days of growth. Assay was repeated 3 times. * p<0.05 **p<0.02 by student’s paired t-test. C. The number of mitotic figures was quantified by IF. Total number of cells and total number of mitotic figures per 25x field was determined. In the UT samples, an average of less than 6 were seen, while an average of 11 were counted after 8 hrs of LatB treatment. D. In mixed glia cultures, both astrocytes and microglia are evident. Cav-2 labeling (red) is abundant in morphologically identifiable astrocytes (large nuclei-DAPI) and localized to mainly PM in morphologically identifiable microglia (*)(left top panel). Cav-3 (green) is highly expressed in these cells, with cytoplasmic and perinuclear distribution. Cav-3 shows novel distribution to MTOC in actively dividing putative PMG cells in mixed cultures, where such cells are more abundant. The last panel is a PMG, in a pure culture from D10% grown cells, with Cav-3 (red) clearly evident during mitotic events, representing a novel localization for a normally PM associated protein, while Cav-1 (green) remains intracellular. Magnification bars = 10μm.

