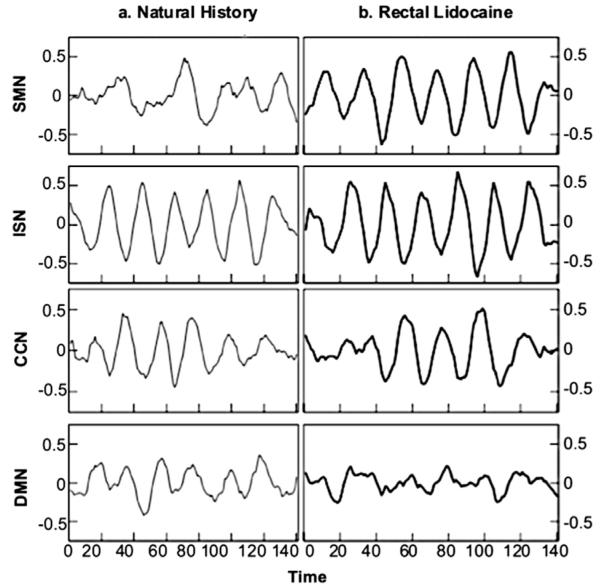
Figure 3.
Lag times reported in the FNC analyses were calculated based on the time courses of the DMN and 3 pain-processing networks (SMN, ISN, and CCN). The waveforms represent each IC’s time course, or pattern of activation, over the period of the fMRI task. Time courses from the ICs in the NH condition are shown on the left, and time courses from the ICs in the RL condition are shown on the right.

