
Figure 7.
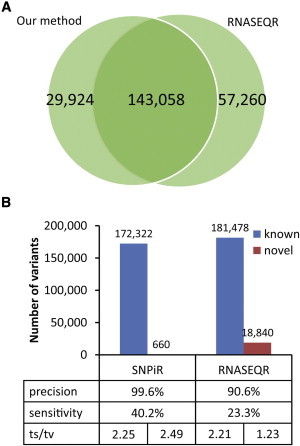
Comparison of SNPiR with RNASEQR
Overlap between the sites detected by SNPiR and RNASEQR on the same RNA-seq data set for GM12878 cells (A) and the number of known and novel variants discovered by SNPiR and RNASEQR, the precision and sensitivity of variant calling, and the ts/tv ratio for each category (B). Precision was calculated as the fraction of RNA-seq variants either supported by WGS or present in dbSNP. Sensitivity was determined as the fraction of WGS variants both found in coding regions and discovered in the RNA-seq data.