
Figure 4.
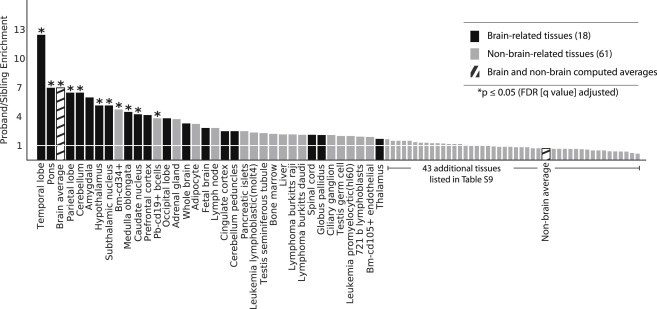
Genes in Proband-Only CNVs from SRS-Discordant Quads Are More Likely Brain-Expressed Genes
We defined a gene to be expressed in a tissue if it ranked in the top 5% of all genes in that tissue and calculated the fold enrichment of proband and sibling genes expressed in each tissue. The tissues with the strongest proband enrichment were part of brain structures (black bars), as was the computed average of expression across 18 brain regions (“brain average”). However, the particular brain tissues with the strongest apparent enrichment should not be considered as independently enriched, given that expression values for individual genes between brain regions are highly correlated. Asterisks indicate a FDR-corrected p value < 0.05. See Figure S9 for results from all 411 quads.