
Figure 5.
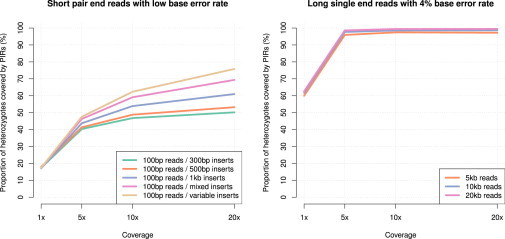
Proportion of Heterozygous Genotypes Covered by Phase Informative Reads (PIRs) in Simulated Data
The x axis shows the sequence coverage while the y axis gives the proportion of heterozygous SNPs covered by PIRs. Results for short pair-end reads are shown on the left plot with read length of 100 bp and various insert sizes: 300 bp insert (green), 500 bp insert (orange), 1,000 bp insert (blue), a mixture of 300/500/1000 bp inserts (pink), and distribution of insert sizes matched to the distribution of distances between heterozygote SNPs (light brown). Results for long reads are shown on the right plot with various read lengths: 5 kb single reads (orange), 10 kb single reads (blue), and 20 kb single reads (pink).