
Figure 1.
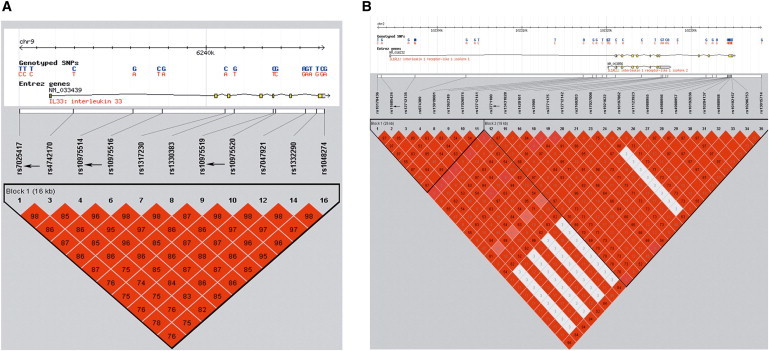
LD Blocks of IL33 and IL1RL1 Based on the HapMap CHB and JPT Data Sets
LD blocks of (A) IL33 and (B) IL1RL1 are shown. The arrows indicate the selected tag SNPs. Each diamond represents the LD degree between the SNPs. The color indicates the D′ (a redder color represents a higher D′) and the numbers within the diamonds are the r2 values (r2 > 0.55 and D′ > 0.83 in the blocks of both genes).