
Figure 3.
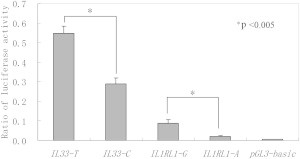
The Reporter Gene Analysis
The luciferase activity was tested by means of cellular extracts. p values less than 0.005 indicate that the difference was statistically significant between the plasmids. Mean ± SD of the relative luciferase activity is shown.