
Fig. 5.
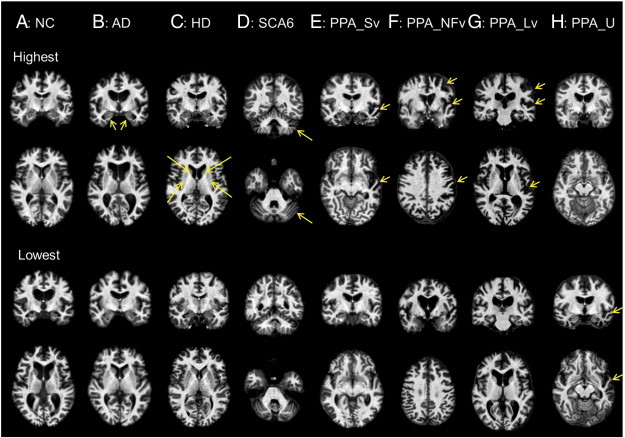
Test images with the highest discriminant score (upper two rows) and the lowest discriminant score (lower two rows). A: Ventricular enlargement was prominent in the NC participant with the lowest NC score. B: The AD participant with the highest AD score showed prominent atrophy in the medial temporal area (yellow arrows), which was not seen in the AD participant with the lowest AD score. C: The HD participant with the highest HD score (HD_es) showed prominent atrophy in the basal ganglia (yellow arrows), which was not seen in the HD_ffo participant with the lowest HD score. D: The SCA6 participant with the highest SCA6 score showed prominent atrophy in the cerebellum (yellow arrows). Cerebellar atrophy was found only in the upper half of the cerebellum in the SCA6 participant with the lowest SCA6 score. E: The PPA_Sv participant with the highest PPA_Sv score showed prominent atrophy in the anterior part of the left temporal lobe (yellow arrows), which was only mildly seen in the PPA_Sv participant with the lowest PPA_Sv score. F: PPA_NFv participant with the highest PPA_NFv score showed prominent atrophy in the left perisylvian areas (yellow arrows), which was only mildly seen in the PPA_NFv participant with the lowest PPA_NFv score. G: The PPA_Lv participant with the highest PPA_Lv score showed prominent atrophy in the left parieto-temporal area (yellow arrows), which was only mildly seen in the PPA_Lv participant with the lowest PPA_Lv score. H: The PPA_U participant with the highest PPA_U score showed only mild ventricular enlargement. However, prominent atrophy in the anterior part of the temporal area (yellow arrows), similar to that in the PPA_Sv, was seen in the PPA_U participant with the lowest PPA_U score. Images are in radiological convention. (For interpretation of the references to color in this figure legend, the reader is referred to the web version of this article.)