
Fig. 2.
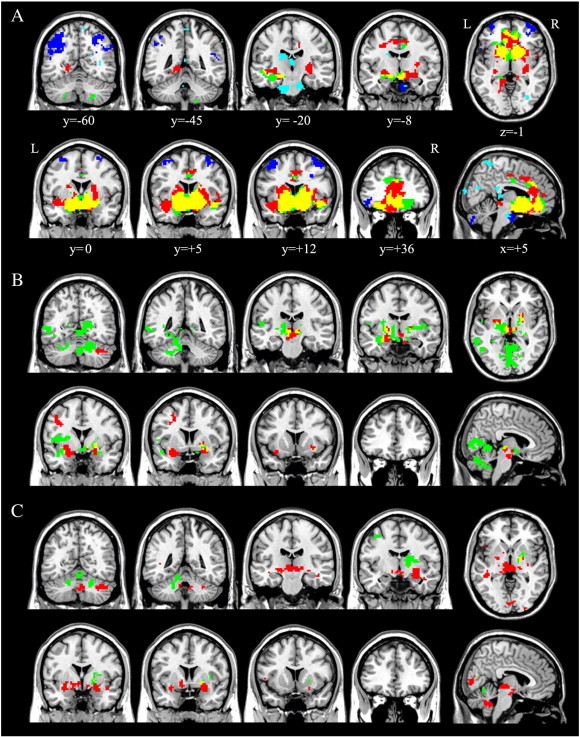
Significant within-group functional connectivity maps of the nucleus accumbens seed region during (A) resting-state, (B) gain anticipation, and (C) loss anticipation. Red indicates positive correlation maps in healthy controls; green, positive correlation maps in patients with OCD; yellow, the spatial overlap of positive correlation maps between two groups; blue, negative correlation maps in healthy controls; cyan, negative correlation maps in patients with OCD; L, left hemisphere; R, right hemisphere. Results are displayed at p < 0.05, topological FDR corrected. (For interpretation of the references to color in this figure legend, the reader is referred to the web version of this article.)