
Fig. 4.
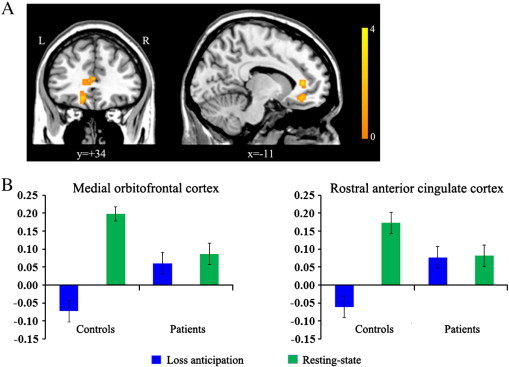
Regions showing significant group differences on FC difference maps between rest and task. When comparing two groups on FC difference maps between rest and loss anticipation, significant group differences were found in functional connectivity of the NA to the med-OFC (x, y, z = − 15, 39, -9; t-/z-value = 4.09/3.54) and rostral ACC (x, y, z = − 9, 39, 6; t-/z-value = 3.54/3.38). Panel B indicates the connectivity strength of the NA to the med-OFC and rostral ACC during loss anticipation and resting-state in each group. We extracted the connectivity strength of the NA to these two regions for each hemispheric seed ROI and each condition, and then these values were averaged for left and right hemispheres for each subject. OCD patients showed less modulation of FC between these two states than controls. Error bars represent standard error from the mean.