
Fig. 5.
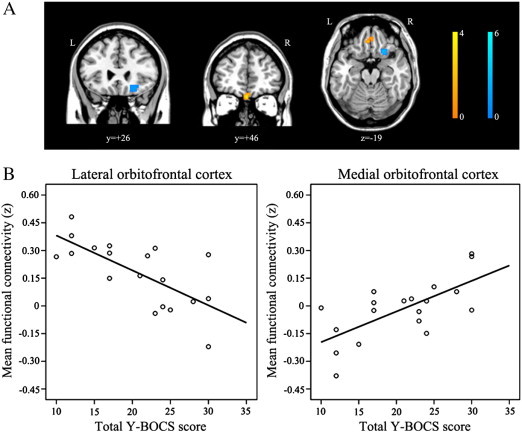
Correlations between the functional connectivity strength of the nucleus accumbens to the orbitofrontal cortex and patients' total Y-BOCS scores (p < 0.001) during resting-state. (A) During resting-state, patient's overall symptom severity was correlated positively with the FC between the NA and med-OFC (warm color) and negatively with the FC between the NA and lat-OFC (cold color) respectively. (B) We extracted the connectivity strength between the nucleus accumbens and OFC regions showing such correlations using Marsbar and then assessed Pearson's correlation between the strength and Y-BOCS scores using SPSS. (For interpretation of the references to color in this figure legend, the reader is referred to the web version of this article.)