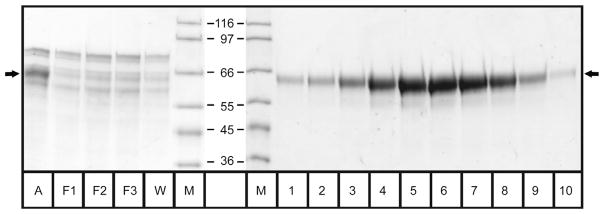
Figure 4. SDS-PAGE of affinity chromatography.

Selected fractions of the affinity chromatography step were analyzed by SDS-PAGE. ‘A’ indicates the applied material, ‘F1’–‘F3’ the fractions of the flow-through, ‘W’ the washing step, ‘M’ the molecular mass markers (the respective weights are given in kDa) and lanes 1–10 show the peak elution fractions. The arrows on both sides mark the furin band.
