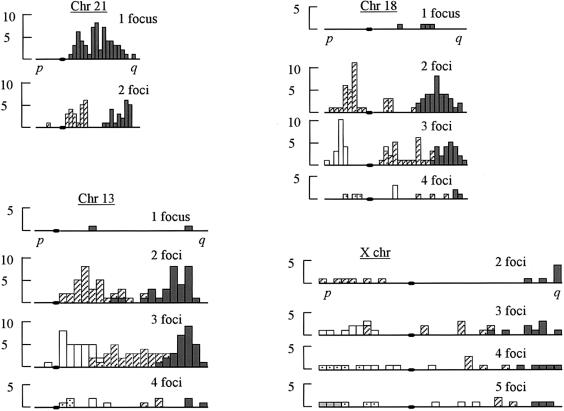
Figure 2 .
Histograms showing the distributions of foci. Each chromosome is divided into 5% intervals (see “Material and Methods”), and the position of the centromere is indicated by a blackened oval on the X-axis. The positions of foci are shown separately (for bivalents with 1, 2, 3, etc., foci). For ease of presentation, the chromosome pairs are not shown to scale.

