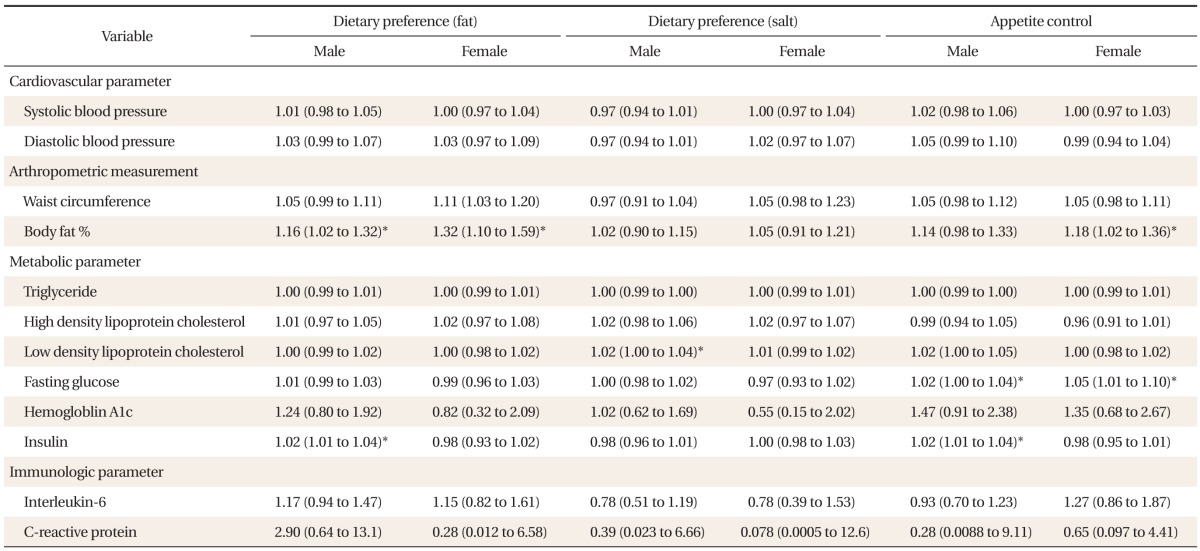
Table 5.
Age-adjusted logistic regression between selected factors for dietary habits and parameters of allostatic load index

Values are presented as aOR (95% CI). OR, CI (low to high) presented for both age-adjusted multivariable logistic regression analysis between parameters of allostatic load and highest quartile of selected factors for dietary habits.
aOR: adjusted odds ratio, CI: confidence interval.
*P < 0.05.
