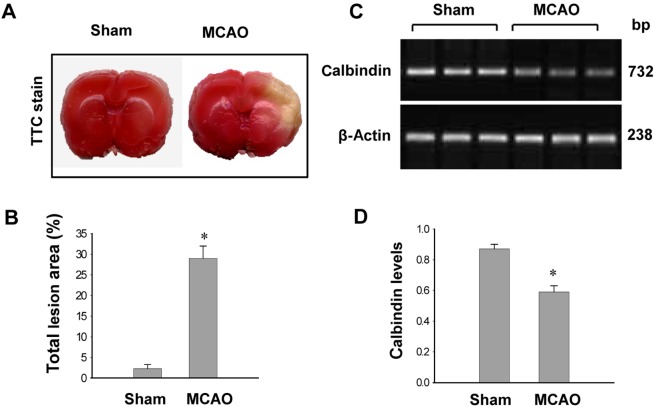
Figure 1.
Photographs of TTC staining (A and B) and RT-PCR data of calbindin (C and D) in the sham-operated and middle cerebral artery occulssion (MCAO)-operated animals. The ischemic area appeared white, while the intact area appeared red (A). The percentage of ischemic lesion area was calculated by the ratio of the infarction area to the whole slice area (B). Densitometric analysis is represented as intensity of calbindin to intensity of actin (D). Data (n=5) are shown as mean±SEM. *P<0.05 (vs. Sham).

