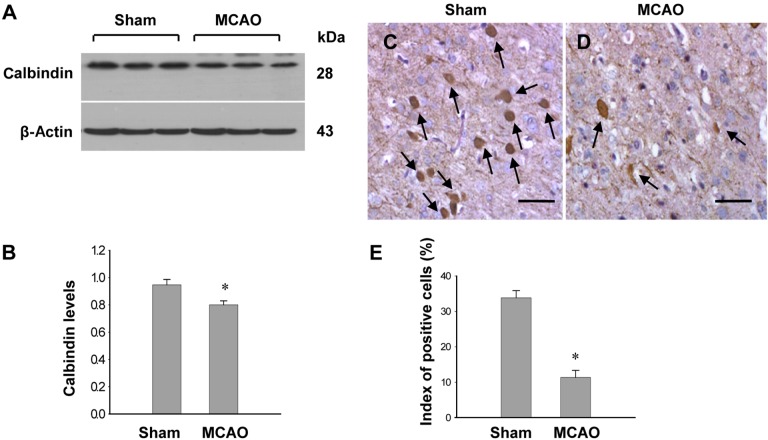
Figure 2.
Western blot analysis of calbindin (A and B) and immuno-staining of calbindin (C and D) in the sham-operated and middle cerebral artery occulssion (MCAO)-operated animals. Densitometric analysis is represented as intensity of calbindin to intensity of actin. Data (n=5) are shown as mean±SEM. *P<0.05 (vs. Sham). Arrows indicate positive cells of calbindin. The index of positive cells indicated the percentage of calbindin-positive cells (E). Scale bar=100 µm.

