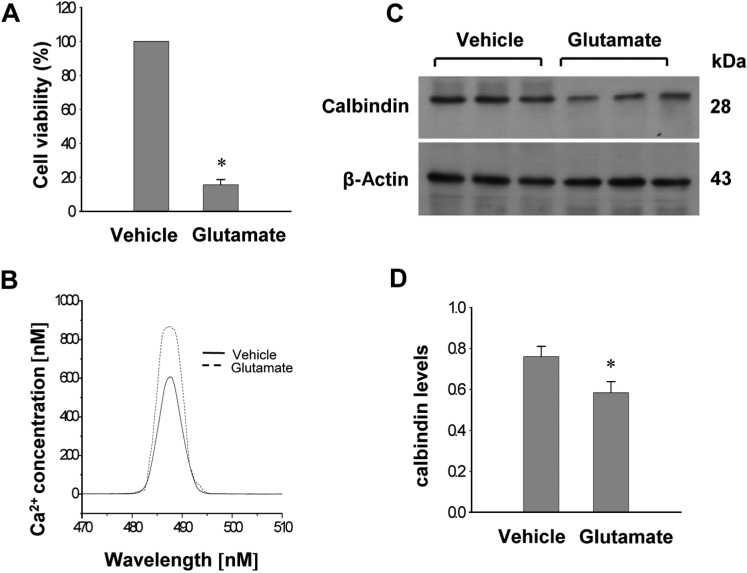
Figure 3.
Cell viability (A), intracellular calcium concentration (B), Western blot analysis of calbindin (C and D) in HT22 cells. Glutamate (5 mM) or vehicle was exposed to HT22 cells for 24 h. Cellular viability was assessed using the MTT assay (A). Cell viability was expressed as percentage of neuroprotection vs. vehicle set at 100%. Neuronal cell are followed by fura-2/AM labeling, and fluorescence spectra for calcium are measured by luminescence spectrophotometer (B). Densitometric analysis is represented as intensity of calbindin to intensity of actin (D). Data (n=5) are represented as mean±SEM. *P<0.05 (vs. Vehicle).

