Figure 1.
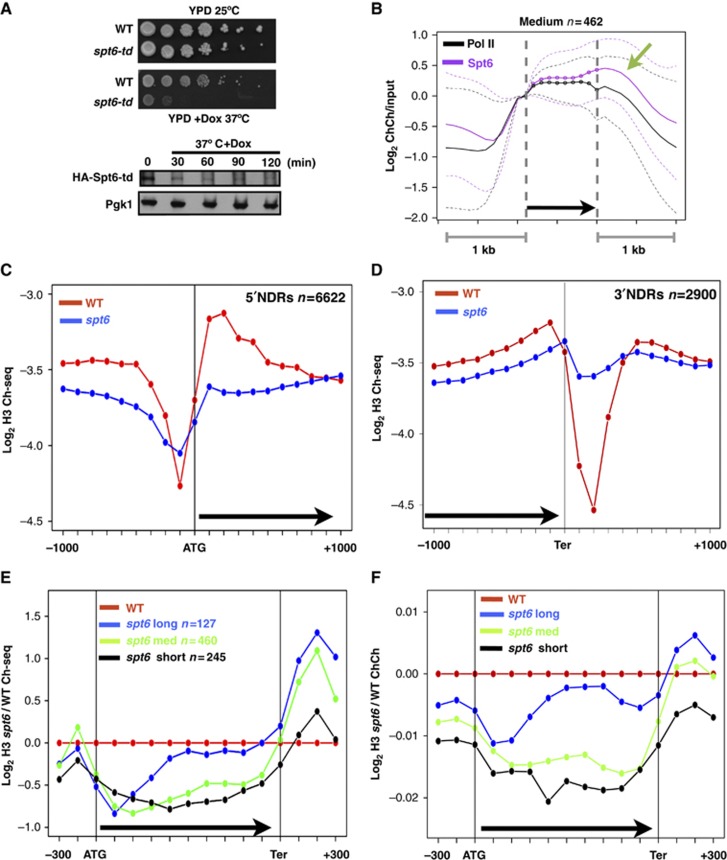
Spt6 degradation and histone eviction in the spt6-td ts degron mutant. (A) Upper panel: Growth defect of the spt6-td degron mutant (DBY875) relative to WT (DBY311) at 37°C+Doxycycline (Dox, 2 μg/ml). Lower panel: Western blot of HA-Spt6 degron fusion at time points after shifting to 37°C+Dox. Pgk1 is a loading control. (B) Average ChIP-Chip (ChCh) profiles of pol II and HA-Spt6 degron at 25°C normalized to the values at the start of the transcription unit on 462 highly transcribed genes 800–2000 bases long as described (Kim et al, 2010). Transcription units are divided into 10 equal intervals (dotted line) with 1 kb of 5′ and 3′ flanking sequences (smooth line). Note enrichment at the 3′ end (arrow). Dashed lines mark the central 80% of genes. (C, D) Average distributions of histone H3 ChIP-seq (Ch-seq) signals in the spt6-td and WT strains (37°C+Dox) at 5′ NDRs of all protein-coding genes and 3′ NDRs of 2900 genes as defined previously (Yadon et al, 2010). Note that within genes most of the H3 loss occurs within the first 500 bases. (E, F) Average distributions of H3 ChIP-seq and ChIP-Chip signals in the spt6-td degron normalized to WT (37°C+Dox) in highly transcribed short (<800 bp), medium (800–2000, bp) and long (>2000, bp) genes described previously (Kim et al, 2010). ORFs are divided into 10 equal bins. Note greater histone loss near 5′ ends and increased occupancy in 3′ flanking regions.

