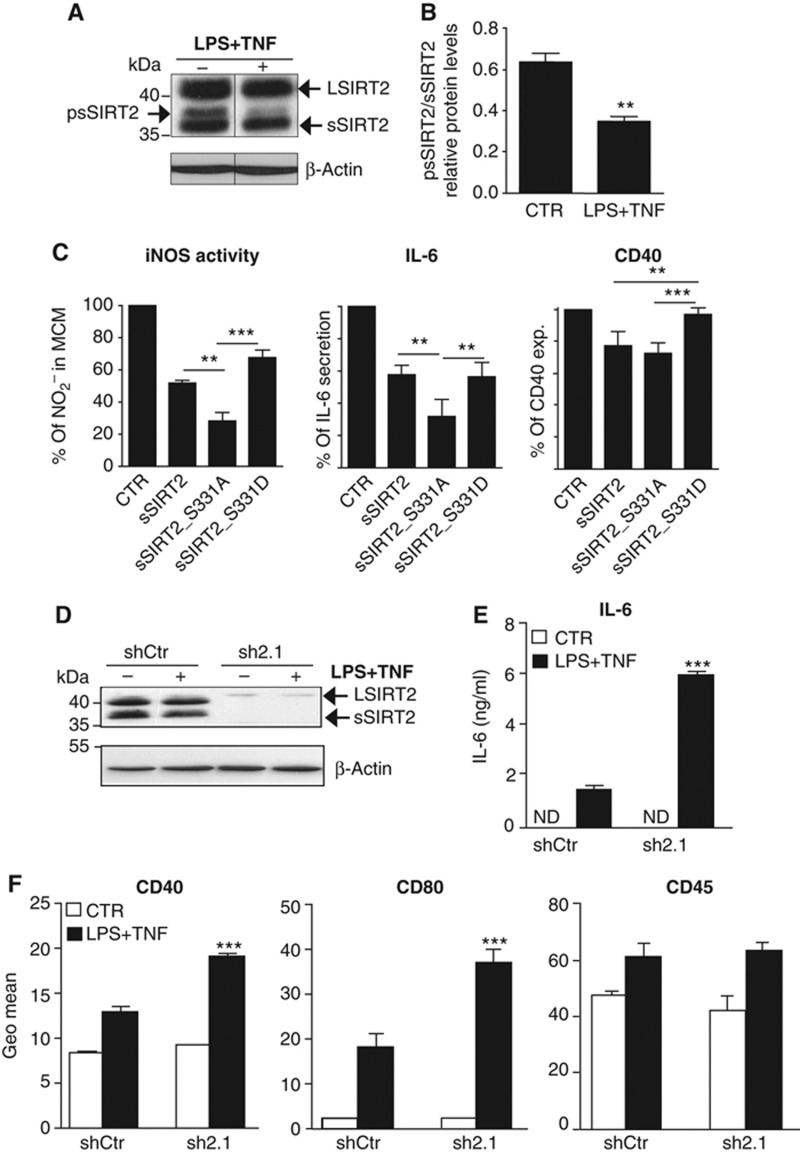
Figure 2.
SIRT2 inhibition of microglial activation depends on S331 phosphorylation. (A) Western blot analysis of microglia activated with LPS and TNF (LPS+TNF) shows clear reduction in a slower migrating protein band (higher MW) corresponding to psSIRT2. Arrows on the right indicate the full (LSIRT2) and shorter (sSIRT2) SIRT2 splicing variants. (B) Microglial activation with LPS+TNF leads to a significant decrease in the level of phosphorylated sSIRT2 (mean±s.d. of three independent experiments, t-test, **P<0.01). (C) Viral-transduced microglial cells were untreated or activated with LPS+TNF and supernatants analysed for nitrites and IL-6, and cells immunostained against CD40 for flow cytometry. The quantification of iNOS activity, IL-6 and CD40 expression results is presented as a relative percentage of the levels quantified in cells viral-transduced with empty vector (CTR) and stimulated with LPS+TNF (mean±s.d., n=4 independent experiments; one-way ANOVA, Tukey’s multiple comparison test, P<0.01). ** and *** are defined by the 95% confidence interval (CI) of difference between means. (D) Western blot analysis showing reduction of SIRT2 protein levels in non-activated (−) or activated with LPS+TNF (+) N9 cells viral-transduced with shRNA specific for SIRT2 (sh2.1) versus control shRNA (shCtr). (E) IL-6 secretion in SIRT2 KD cells. KD or shCtr-transduced cells were left untreated (CTR, white squares) or activated with LPS+TNF (black squares). IL-6 levels were determined by ELISA. (F) Expression of membrane activation markers in SIRT2 KD cells. Quantification of CD40, CD80, and CD45 expression was done by flow cytometry analysis and represented by the Geo Mean of the histograms obtained for the fluorescence intensity of stained cells. In (E) and (F), data are presented as mean±s.d. and representative of three independent experiments done in triplicate, two-way ANOVA, ***P<0.001. ND, not detectable.
Source data for this figure is available on the online supplementary information page.

