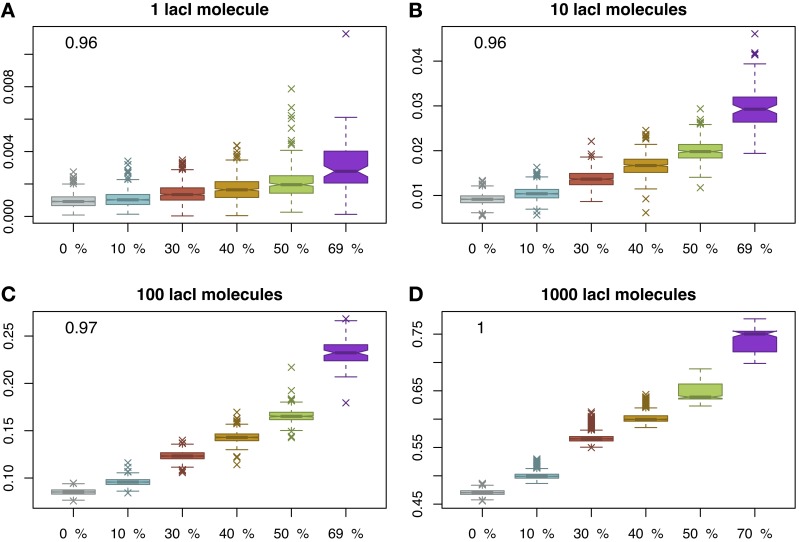
Figure 4.
Proportion of time relative to the cell cycle that the target site is occupied (y-axis) as a function of DNA crowding (x-axis) in the case of immobile obstacles. For each set of parameters, we performed 1000 simulations. The mean occupancy of the target site is highly correlated with the crowding level on the DNA for all lacI abundances. Note that, for higher crowding, the number of simulations where the target site is reached within 3000 s decreases and, for 70% of the DNA being covered by DNA binding proteins, the probability to locate the target site drops to 0.1; see Figure S1 in the Supplementary Material. The number in the inset represents the Pearson coefficient of correlation between crowding and the mean of the proportion of time the O1 site is occupied. The values indicate that crowding is highly correlated with the proportion of time the target site is occupied, in the sense that higher crowding on the DNA leads to higher occupancy of the target site by cognate TFs. Note that to enhance the visibility, the boxplots are positioned equidistant although the crowding levels are not. We considered four cases with respect to the number of lacI molecules, namely: (A) 1 molecule, (B) 10 molecules, (C) 100 molecules and (D) 1000 molecules.

