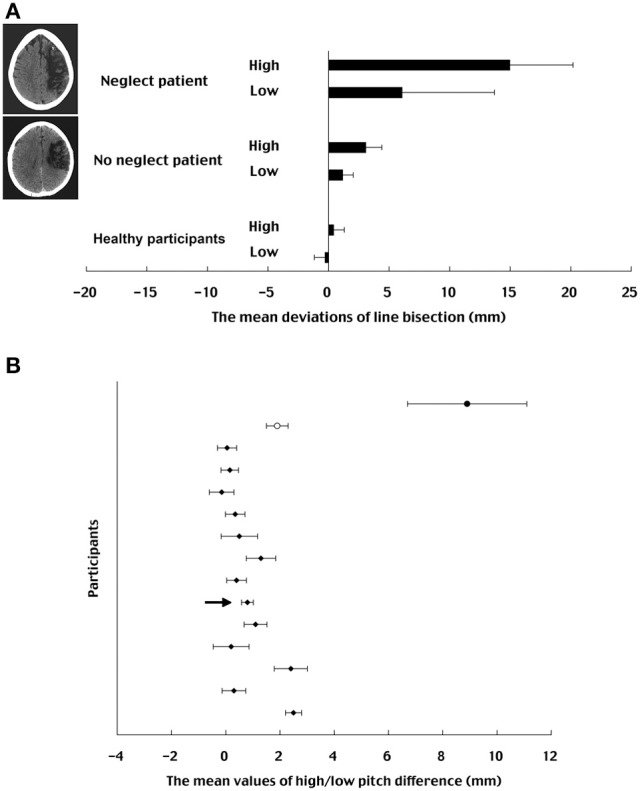
Figure 2.

(A) The mean deviations of line bisection for auditory pitch in each patient. MRI scans of the neglect and no-neglect patients are presented together. The mean deviations for each pitch in healthy participants of Experiment 1 (horizontal orientation with alternative pitch presentation condition) were also imposed on the figure. Each bar indicates the range of one standard error. (B) The mean values of high/low pitch difference in each participant (filled circle: neglect patient; unfilled circle: no-neglect patient; filled diamond: normal healthy participants). Each bar indicates the standard deviation. The arrow indicates the data point of a selected healthy participant used for specific analyses specified in the text.
