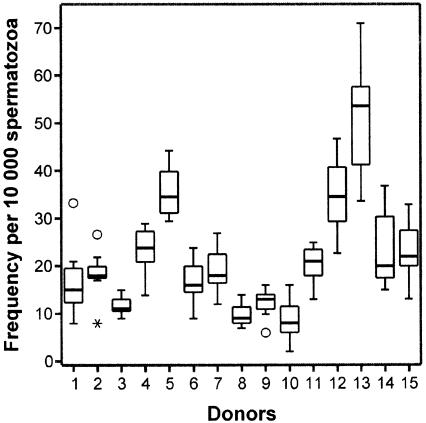
Figure 1.
Box plots for comparing the within-person distributions of aggregate frequencies of sperm carrying any of the numerical abnormalities detected by the X-Y-8 sperm method FISH among the 15 men of the study, on the basis of seven samples per donor collected over a 2-year period. The aggregate frequency is the sum of the four aneuploidy and three diploidy categories detected by the X-Y-8 FISH sperm method (see “Patients, Materials, and Methods” section). The vertical height of each box represents the 25%–75% data range, the horizontal line within each box represents the median value, and the upper and lower extensions represent the largest and smallest values that were determined to not be outlier specimen among the seven specimens for each donor. Among the 105 specimens in this study, 4 were considered to be either of two types of outliers: unblackened circles (○) denote simple outliers, individual sperm specimens whose frequency of abnormal sperm fell >1.5 box lengths from the 25th percentile of the distribution for the seven specimens evaluated per donor, whereas an asterisk (*) denotes an extreme outlier, an individual specimen whose frequency of abnormal sperm fell >3 box lengths from the 25th percentile of the distribution for the seven specimens evaluated per donor.

