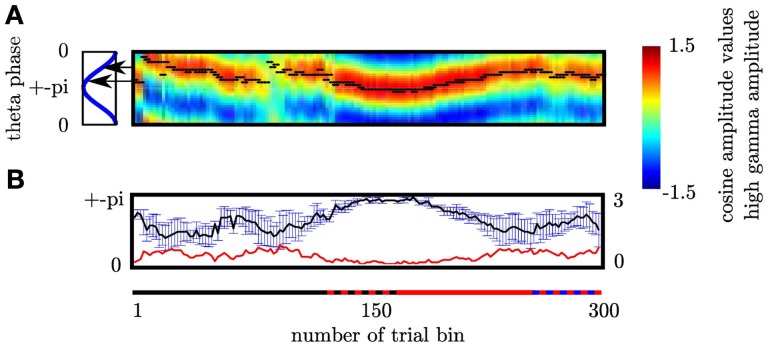
Figure 10.
(A) Cognitive demands in different sequence types are reflected by difference in coupling phase. In each trialbin we determined the modulating phase of the θ cycle. Black dots denote the phase the high γ amplitude is coupled to for each trial bin. The sequence type is indicated by the colored line: black corresponds to fixed, red to random and blue to self paced trials. The alternating red-black line denotes those trial-bins containing both fixed and random trials. Alternating blue-black line denotes those trial-bins containing both random and self-paced trials. Phase differences were investigated comparing trial bins containing exclusively fixed and random trials, respectively (solid black and solid red intervals). Black arrows mark the mean θ phase. Coupling phases differ significantly between fixed and random trial bins. Please note that at the beginning of the entire experiment, when the sequence to be learned is unknown high gamma amplitude peaks at the same frequency as during the unpredictable random sequence. (B) During HCC high gamma amplitude is coupled to the θ trough across subjects while during LCC the coupling phase is different across subjects as indicated by the greater errorbars during trialbins of LCC. In each trial bin we grouped the high gamma amplitude according to the 30 θ bins for the temporal interval ranging from 0 to 200 ms. We fitted a cosine function to the resulting 30 high gamma amplitude values. The coupling phase of the θ oscillation was defined as the phase at which the high gamma amplitude was maximal. This leads to 3 coupling phases one per each subject in each trial bin. To better illustrate the in-phase coupling we collapsed the rising and the falling part of the θ cycle. Therefore, the y-axis ranges from 0 (θ peak) to ± π (θ trough). The x-axis gives the number of trial bins. The upper plot shows the average and the standard error of mean (SEM) of coupling phases across subjects for each trial bin. To better visualize this dependency of the SEM on the cognitive control we inserted the course of SEM over trial bins (red line) shows the standard error. This line demonstrates that the standard error across subjects is low in trial bins of HCC and high in trial bins of LCC.

