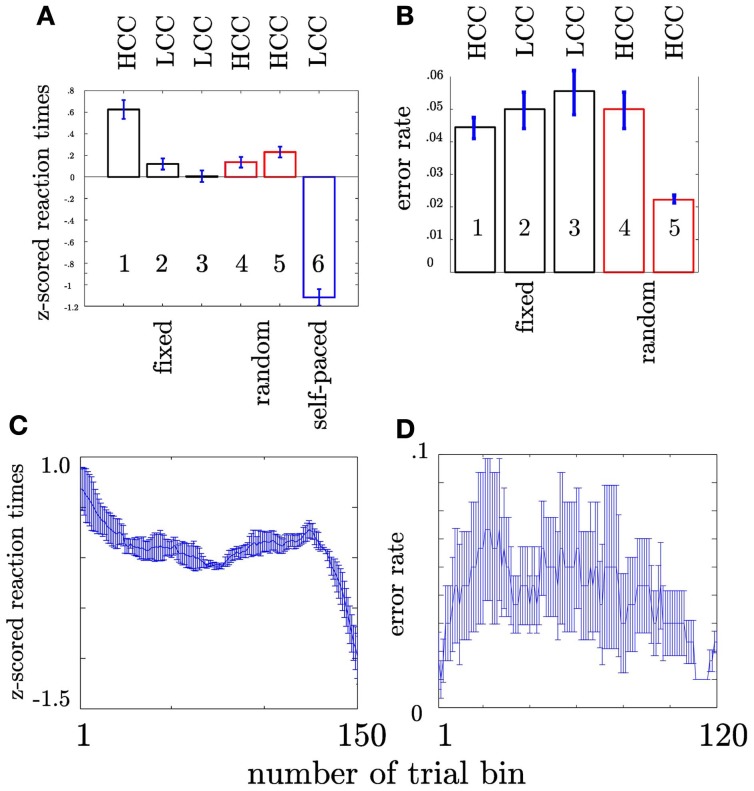
Figure 3.
Depiction of behavioral results. x-axis: sequence type. Numbers within the bars show the number of the block. HCC and LCC above the bars indicate the level of cognitive control necessary to perform the task (HCC—high cognitive control and LCC—low cognitive control) (A) Reaction times were pooled across subjects and trials. Each bar encompasses reaction times of 180 trials (1 block). Error bars represent the standard error across trials. The color of the bar indicates the sequence type as in Figure 1. Trialwise reaction times vary in accordance with sequence type. For more clarity post-hoc differences are summarized in Table 2. Participants show increasingly faster response with training the fixed sequence. Following the fixed sequence reaction times are slower during the random sequence. (B) Error rates per block pooled across subjects. Error rates are only shown for fixed and random blocks since no error can be calculated for self-paced blocks. (C) Depiction of the evolution of RT across the trial bins. The error bars in both plots denote the standard error of the mean. (D) Depiction of the evolution of error rate across the trial bins. The error bars in both plots denote the standard error of the mean

