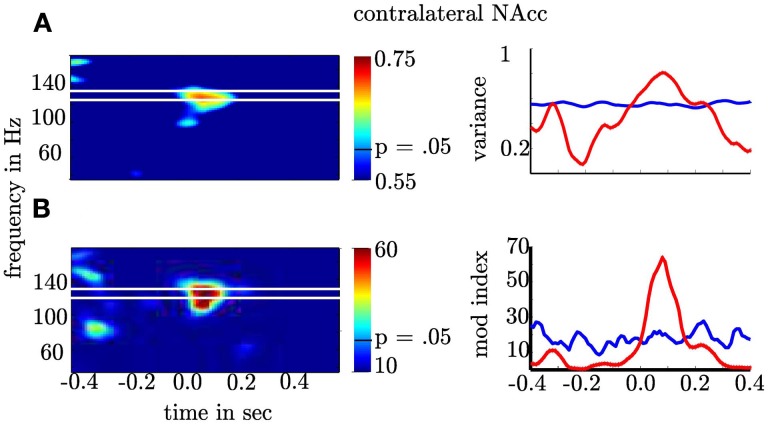
Figure 6.
Depiction of θ-high γ PAC for the contralateral NAcc. (A) The first row gives the as a function of time (x-axis) and frequency (y-axis). (B) The second row shows the modulation index. The second column shows the frequency band (≈100–140 Hz; red line) with significant increase of and PAC. The blue lines denote the 97.5th percentile used as confidence interval of the normal distribution for σ2 and F-distribution for MI. Note that the variance and the Modulation index exceeded the significance threshold for more than 200 ms and each point is the result of a temporal interval of 166 ms. This means that coupling is present in non-overlapping temporal intervals and hence, extents across several cycles.

