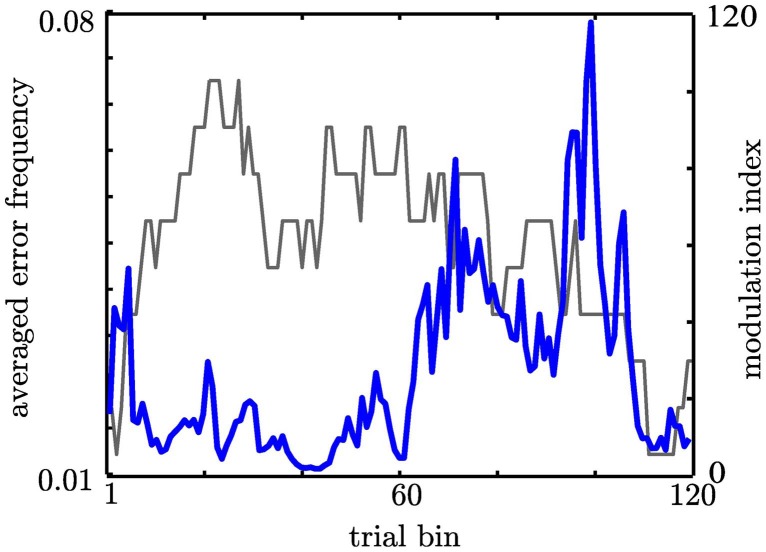
Figure 9.
Coupling strength predicts the probability to make an error as indicated by the correlation analysis. Here we depict both correlated measures to illustrate the resembling course over time. The gray line gives the probability to make an error across subjects. The blue line shows the Modulation Index.

