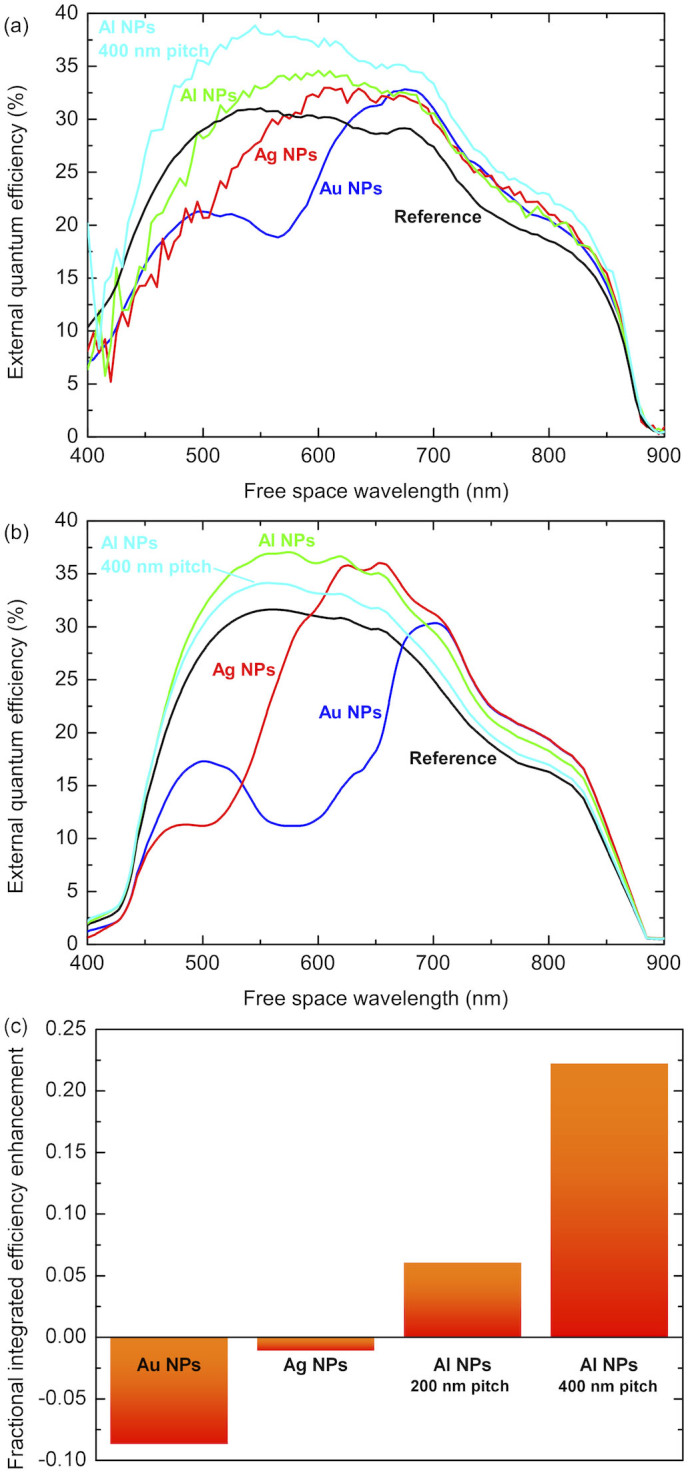
Figure 2. Experimental and calculated photocurrent spectra and enhancement ratios.

(a) Experimentally observed and (b) numerically calculated EQE spectra plotted as a function of wavelength for a reference photodiode (black line) and devices with periodic Au (blue), Ag (red) and Al (green) nanoparticle arrays of 200 nm pitch and an Al array of 400 nm pitch (light blue). (c) Integrated EQE enhancement provided by each of the nanoparticle arrays plotted with respect to the reference device, taken from the experimental data.
