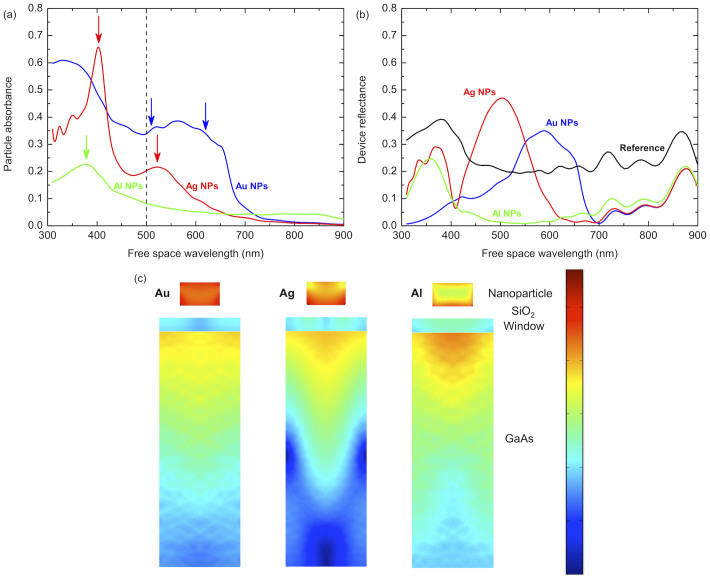
Figure 3. Simulated optical response of the nanoparticles and device active region.
(a) Absorbance of the metallic nanoparticles plotted as a function of wavelength for Au (blue), Ag (red) and Al (green) and (b) the simulated reflectance spectra for those devices and the reference (black). (c) Vertical slice colour maps through the device showing the absorption at λ = 500 nm in the nanoparticles, window layer and p-n junction regions for Au, Ag and Al arrays (all colour maps use an identical logarithmic colour scale).

