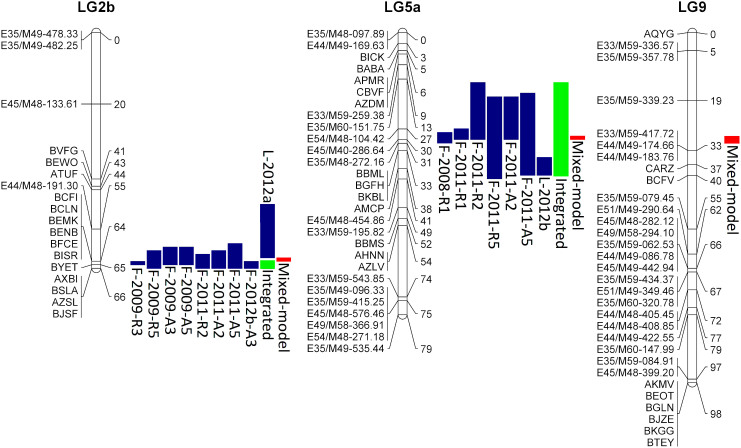
Figure 2. Location of qDM2.1, qDM5.1, and qDM9.1 on the genetic linkage map of lettuce.
Genetic distances in Kosambi centimorgans (cM) are indicated at the right of each linkage group. Blue and green vertical bars correspond to location of QTLs and 1-LOD support intervals calculated from individual experiments and integrated rating, respectively. Red bars show results from mixed-model analysis and support intervals calculated by QTLNetwork software. QTL qDM2.1 is located on LG 2b, QTL qDM5.1 is located on LG 5a, and qDM9.1 is located on LG 9.

