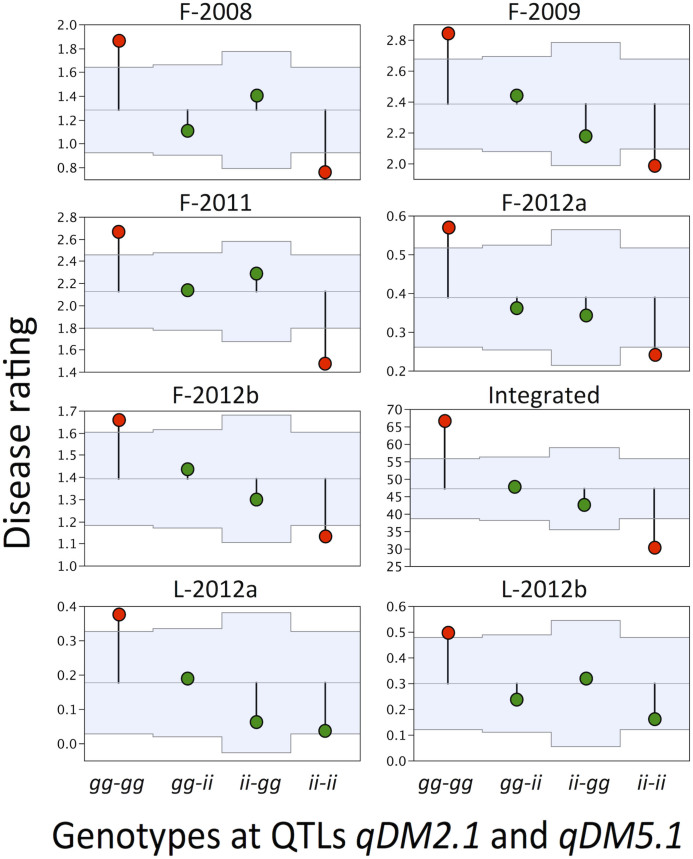
Figure 3. Testing potential of molecular markers for marker-assisted selection (MAS) with analysis of means (ANOM).
The ANOM tests which of the four allelic combinations are associated with resistance that is significantly different from the overall resistance in the population. Areas in light blue show upper and lower bounds of decision limits. Values that are outside decision limits (marked in red) are significantly different (P < 0.05) from the overall mean. ANOM analyses were conducted on last disease ratings from field experiments, sporulation of pathogen 7 days after inoculation in laboratory experiments, and integrated data of these seven experiments. QTL genotypes are based on molecular markers BYET and E45/M49-286.64 that are closely linked to qDM2.1 and qDM5.1, respectively. The first two letters of genotypes show alleles at qDM2.1 and the other two letters show alleles at qDM5.1. Only recombinant inbred lines homozygous for either Grand Rapids alleles (gg) or Iceberg alleles (ii) were considered in the analysis.

