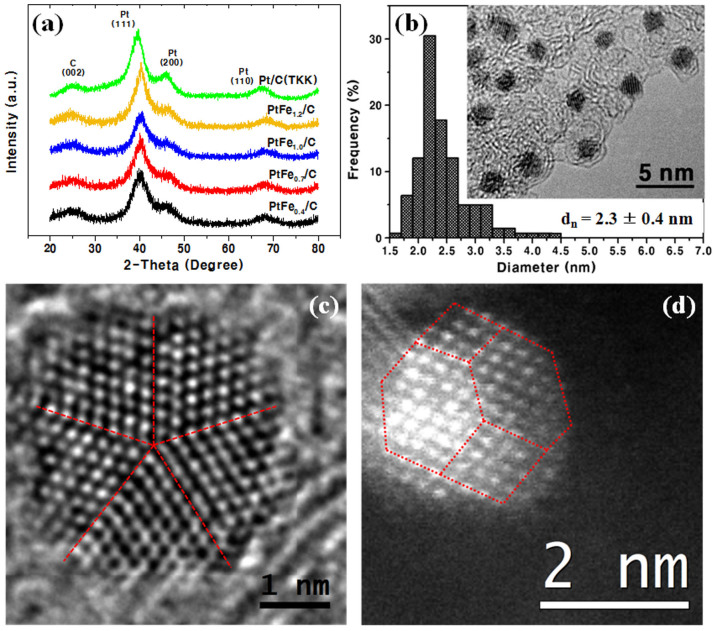
Figure 2.
Structural analysis results (a) X-ray diffraction (XRD) patterns of the PtFex/C samples in comparison with commercial Pt/C. (b) Size distribution histogram and transmission electron microscopy (TEM) image, (c) magnified bright field STEM image of the representative PtFe1.2 NPs and (d) magnified HAADF-STEM image.

