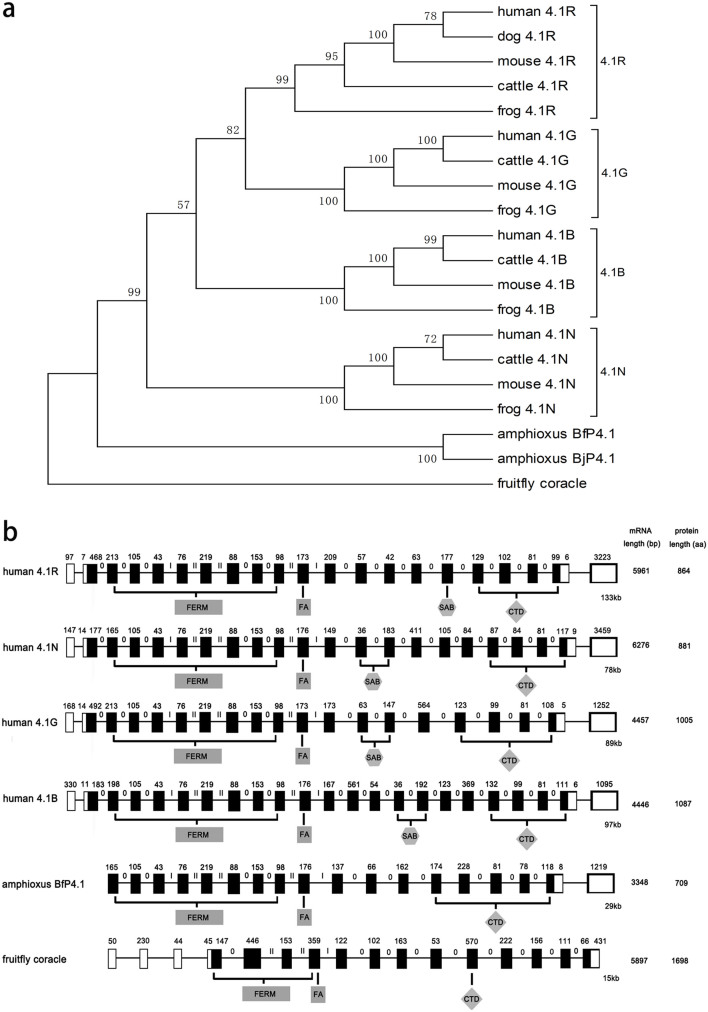
Figure 2. Phylogenetic tree and genomic structures.
(a) Phylogenetic tree of 4.1 proteins. The phylogenetic tree was constructed by the neighbor-joining method within the package MEGA 5.0 software package using 1000 bootstrap replicates. Note that amphioxus protein 4.1 was positioned at the base of vertebrate protein 4.1R, 4.1G, 4.1B, and 4.1N. (b) Genomic structures of protein 4.1 genes in human, amphioxus and fruit fly. The open and black rectangles represent non-coding exons and coding exons respectively. The horizontal lines between two rectangles represent intron. The numbers above the rectangles represent the nucleotide number of each exon. The Roma numbers above the horizontal lines show the intron phase.

