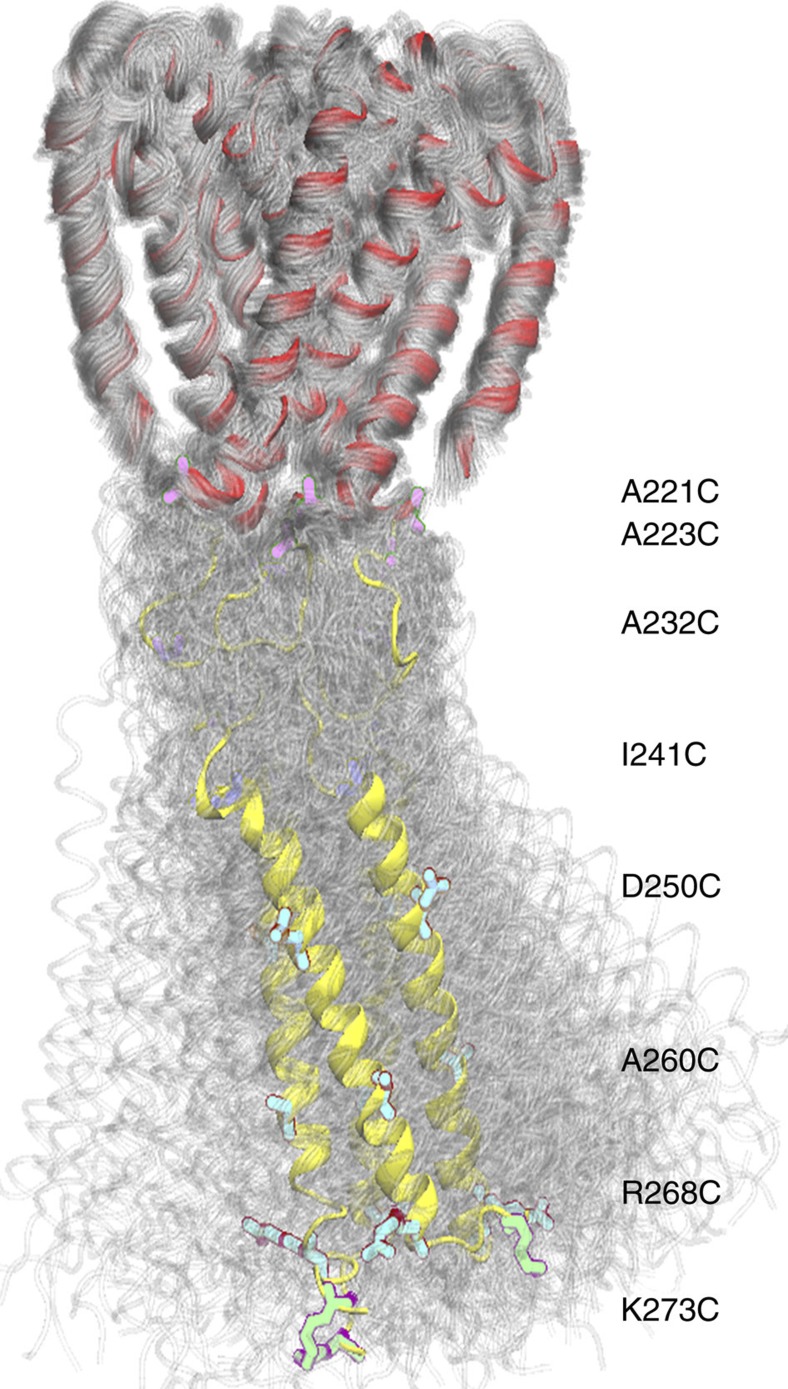
Figure 3. DEER-derived model showing the dynamics of the pore and CTD.
Individual structures from separate trajectories are overlaid to show the large motions in the CTD, clearly indicating why this region is not well ordered in the crystal electron density map. See also Supplementary Movie 1.

