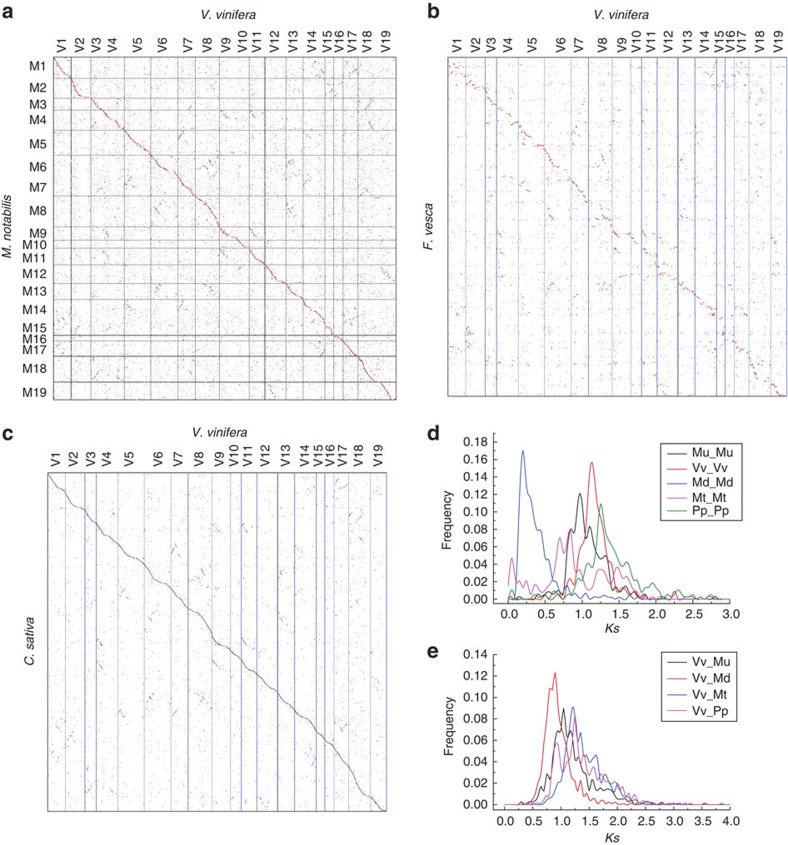
Figure 6. Dotplots of species and Ks distributions.
M. notabilis–V. vinifera (a), F. vesca–V. vinifera (b), C. sativa–V. vinifera (c) and Ks distribution of within-each-plant homologues (d) and between-different-plant homologues (e) in collinearity. For M. notabilis and C. sativa, gene coding DNA sequences of V. vinifera were searched against their genomes by using BLASTN, and their hit locations were found. This BLASTN information was used to produce the dotplots. Unanchored scaffolds were linked together as to their best-matched grape genomic regions, and the putative pseudochromosomal regions of M. notabilis and C. sativa genomes were produced. For F. vesca, protein–protein searches using BLASTP were conducted to reveal putative homologous genes, and this information was used to make dotplot; along chromosomes, genes were placed with their chromosomal order as coordinates.

