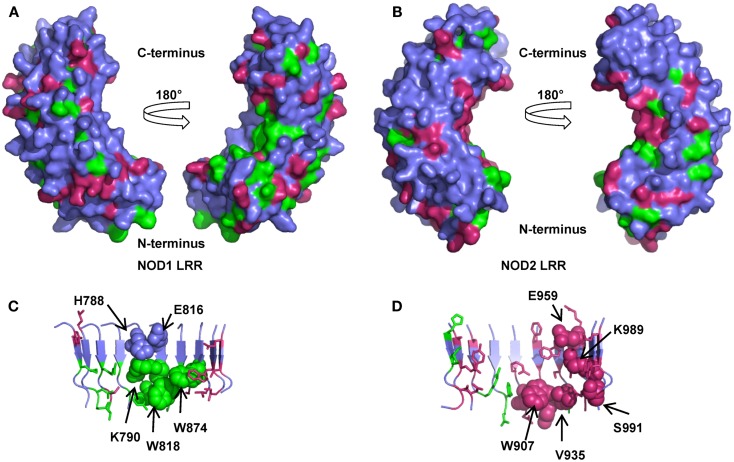
Figure 5.
Amino acid conservation in the NOD1 and NOD2 LRRs. Surface representations of homology models of the NOD1 (A) and NOD2 LRRs (B) showing residues conserved across species (green) or just across mammals (pink). For clarity signature residues conserved in the consensus LRR repeat LxxLxLxxNxL (signature residues L and N) are not represented. The left and right images in (A,B) are related by a 180° rotation around the vertical axis. Cartoon representations of the concave surface of the NOD1 (C) and NOD2 (D) LRRs highlight the spatial relationships of residues likely to be involved in ligand detection. The side chains of residues previously implicated in ligand detection and receptor activation are represented as spheres and labeled appropriately except for G792, G818 (NOD1), and G879, G908 (NOD2). Residues are colored as for (A,B).

