Figure 1.

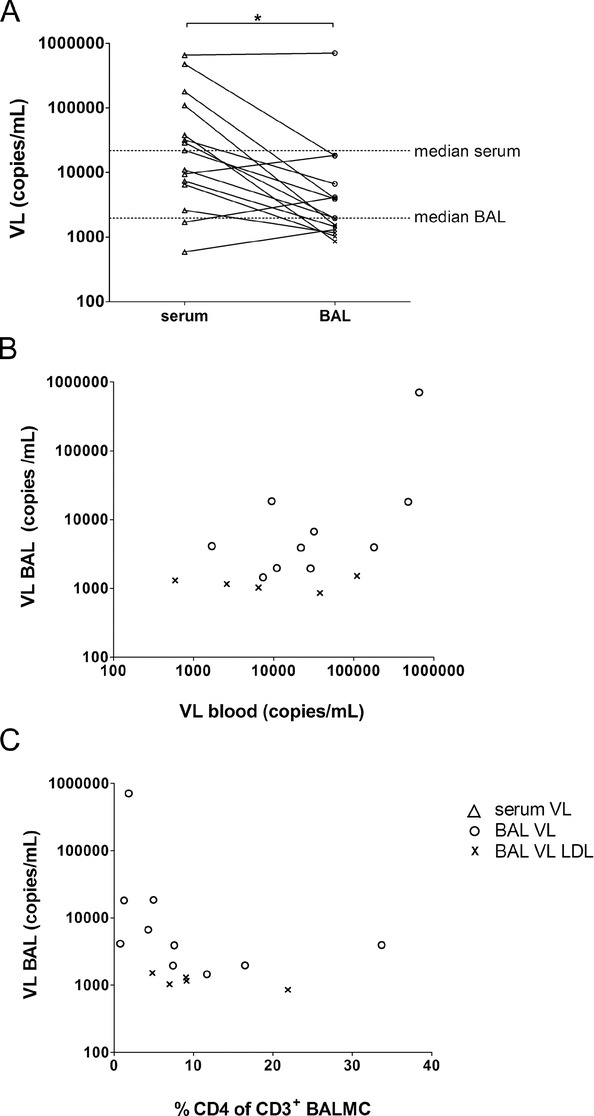
Viral load (VL) in bronchoalveolar lavage (BAL). (A) Paired VL in serum (n = 15, open triangles) and BAL fluid (n = 15) was measured by nucleic acid amplification tests of gag for the quantitation of human HIV-1 RNA. The detection limit was 20 copies/800 μL of pure BAL fluid. BAL VLs above the detection limit are depicted with open circles (n = 10). BAL VL values lower the detection limit (LDL) were set to a value of 19 copies/mL and normalised according to the urea method (n = 5, symbol ×). Each symbol represents an individual sample, horizontal lines represent median VL of serum and BAL. *p = 0.030 between serum and BAL VL, Wilcoxon signed rank test. (B) Correlation between VL in serum and BAL was assessed by Pearson (ρ = 0.787, p < 0.001) and (C) correlation between VL BAL and the relative frequency of CD4+ CD3+ BAL T cells was assessed by Spearman (ρ = −0.586, p = 0.022). Data shown are pooled data from 15 experiments performed.
