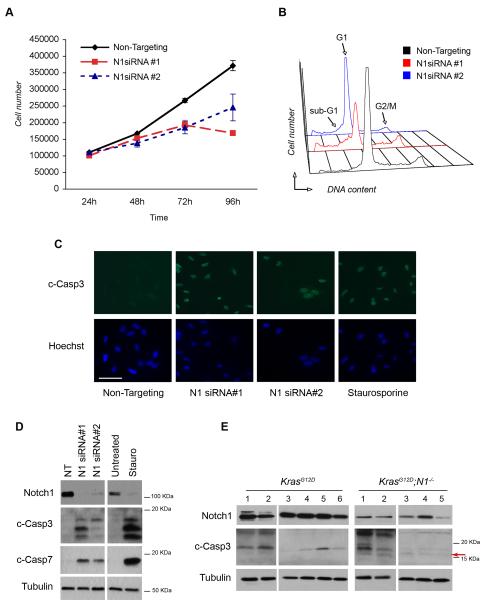
Figure 2. Notch1 ablation induces apoptosis.
(A) Growth curve of A549 cells after Notch1 knockdown with siRNA#1 and siRNA#2. Cells were counted in triplicate starting 24 hours after transfection. Error bars= mean ± SD. One representative experiment of 3 is shown. (B) Cell cycle profiles of A549 cells after Notch1 knockdown. 72h after transfection cells were fixed and stained with propidium iodide (PI) and analyzed for DNA content. The experiment was repeated 3 times. (C) Immunofluorescence staining of cleaved caspase-3 after Notch1 knockdown. Cells were fixed in paraformaldehyde and stained 72h after Notch1 siRNA#1 and siRNA#2 transfection. Treatment with staurosporine (500nM, 16h) was included as a positive control for apoptosis. Scale bar: 50μm. (D) Western blot analysis for caspase-3 and caspase-7 activation. Cells were harvested 72h after transfection. Staurosporine= positive control. (E) Western blot analysis of lung tumors from K-rasG12D and K-rasG12D;Notch1flox/flox mice at 14 weeks after Ad-Cre administration. Protein extracts were analyzed for Notch1 and cleaved caspase-3. Arrow=17KDa cleavage form that is only present in Notch1 deleted samples. Tubulin= loading control.

