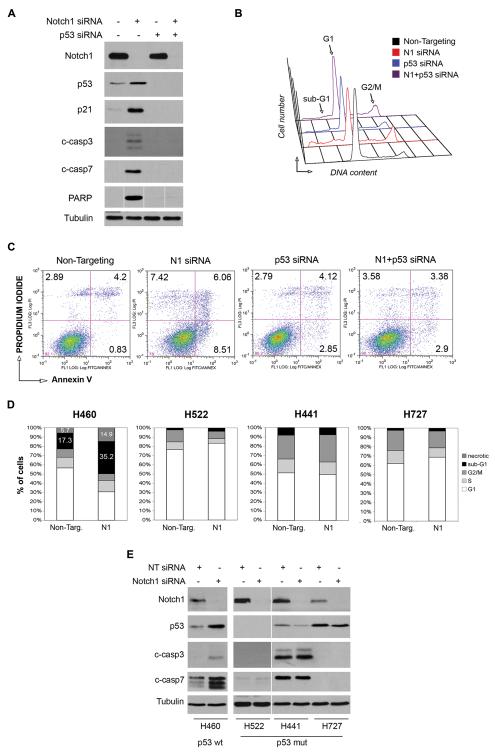
Figure 4. p53 stabilization mediates apoptosis induced by Notch1 ablation.
(A-C) Rescue of Notch1 siRNA-induced apoptosis by p53 siRNA in A549 cells. All experiments were performed 72h after transfection. (A) Western blot of cells transfected with Notch1 siRNA#1, p53 siRNA or both, compared to Non-Targeting siRNA cells. Protein extracts were analyzed for p53 and p21 expression, caspase-3, caspase-7 and PARP cleavage. Tubulin= loading control. (B) Cell cycle analysis. Cells were fixed and stained with propidium iodide (PI) for DNA content. (C) FACS analysis of apoptosis by Annexin-V staining. Cells were fixed and stained with Annexin-V and PI. Numbers indicate the percentage of cells in the respective quadrant. Experiments were repeated three times, one representative experiment is shown. (D-E) Effect of Notch1 knockdown in NSCLC cell lines H460, H522, H441 and H727 (D) Cells were transfected with Notch1 siRNA#1 and stained with PI at 72h post transfection. Percentages of cells in the different phases of cell cycle plotted for each cell line. (E) Western blot analysis of Notch1 and p53 expression and caspase3 and caspase7 cleavage after Notch1 knockdown. Tubulin= loading control.

