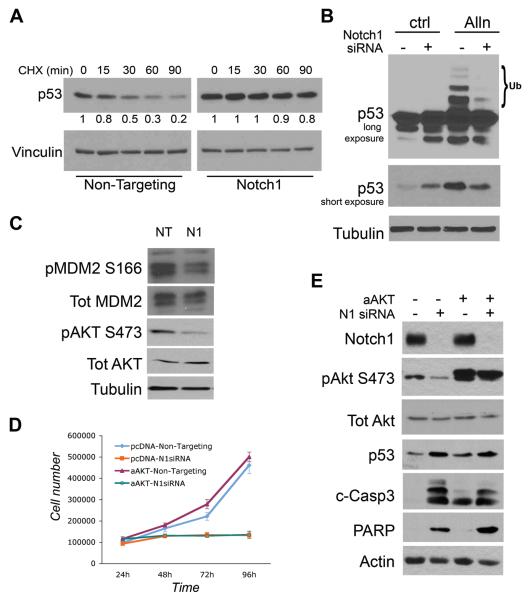
Figure 5. Notch1 controls p53 stability and MDM2 phosphorylation independently of Akt.
(A) 72h post transfection with Non-Targeting or Notch1 siRNA A549 cells were treated with CHX (10 μg/ml) for the indicated times. Whole cell protein extracts were analyzed by Western blot for p53. Vinculin= loading control. (B) Notch1 and Non-Targeting siRNA transfected cells were treated with ALLN (50 μM) for 6h. Protein extracts were analyzed by Western blot for expression of Notch1 and p53. Vinculin= loading control. (C) Non-Targeting and Notch1 siRNA-treated cells were analyzed by Western blot for expression and phosphorylation status of MDM2 and Akt. Tubulin= loading control. (D) A549 cells stably transfected with active Akt (aAkt) were transfected with Non-Targeting and Notch1-siRNA. Cells were counted in triplicate starting 24h post transfection. Error bars= mean ± SD. (E) Cells treated as in (D) were analyzed by western blot with the indicated antibodies 72h after siRNA transfection.

